Key research themes
1. How can semiconductor photocatalysis be optimized for environmental and energy applications?
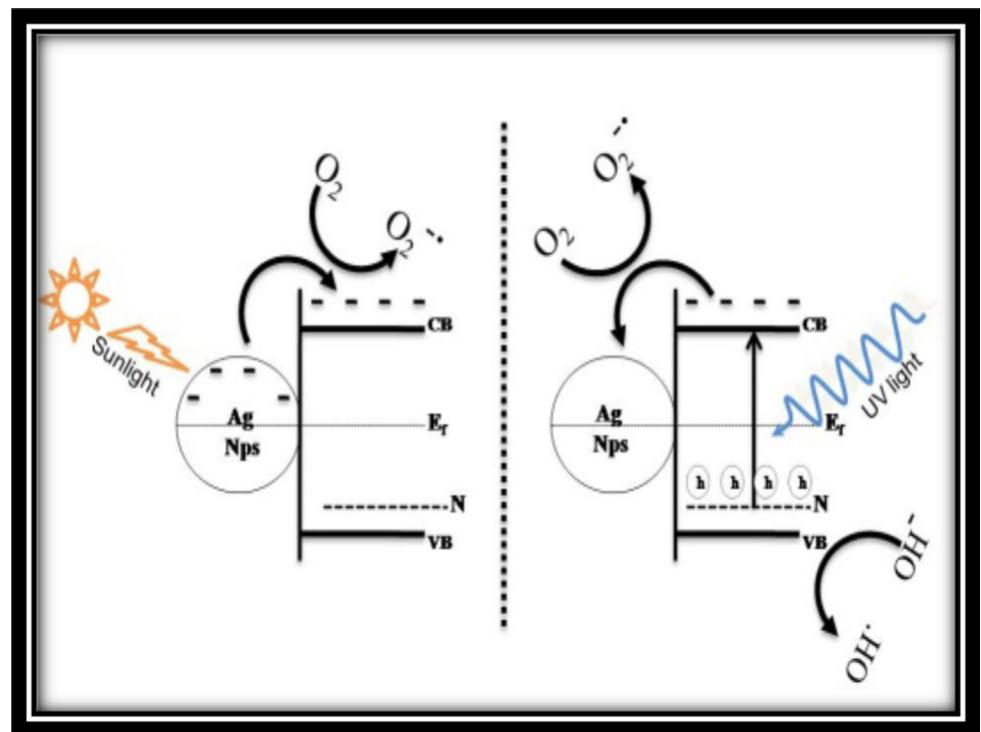
This research area focuses on understanding the fundamental mechanisms of semiconductor photocatalysis, improving photocatalytic efficiency, expanding spectral sensitivity, and applying these materials in environmental remediation and solar fuel production. The optimization of semiconductor photocatalysts such as TiO2, via doping, heterojunction formation, and noble metal deposition, is critical for enhancing their activity under visible light and enabling practical applications like water splitting, pollutant degradation, and solar energy conversion.
2. What are the advancements and challenges in reactor design and scale-up for photochemical and photocatalytic processes?
This theme investigates the engineering and methodological innovations in photochemical reactor design, focusing on achieving scalable, efficient, and well-characterized photon, mass, and heat transfer environments to enable reproducible research and industrial application of photochemical reactions. It explores continuous-flow systems, compact photoreactors, photonic profiling, and the translation of laboratory photoreactions to larger scales while maintaining reaction efficiency and selectivity.
3. How can photochemistry and photophysics be effectively integrated into education and measurement standards for enhanced scientific understanding?
This theme covers pedagogical approaches, instrumentation, and standardization efforts necessary to deepen scientific and practical understanding of photochemical and photophysical phenomena. It includes the development of educational experiments and curricula, precise measurement methodologies for photochemical reactions, and internationally harmonized terminology and units to facilitate clarity, reproducibility, and interdisciplinarity in photochemistry-related research.
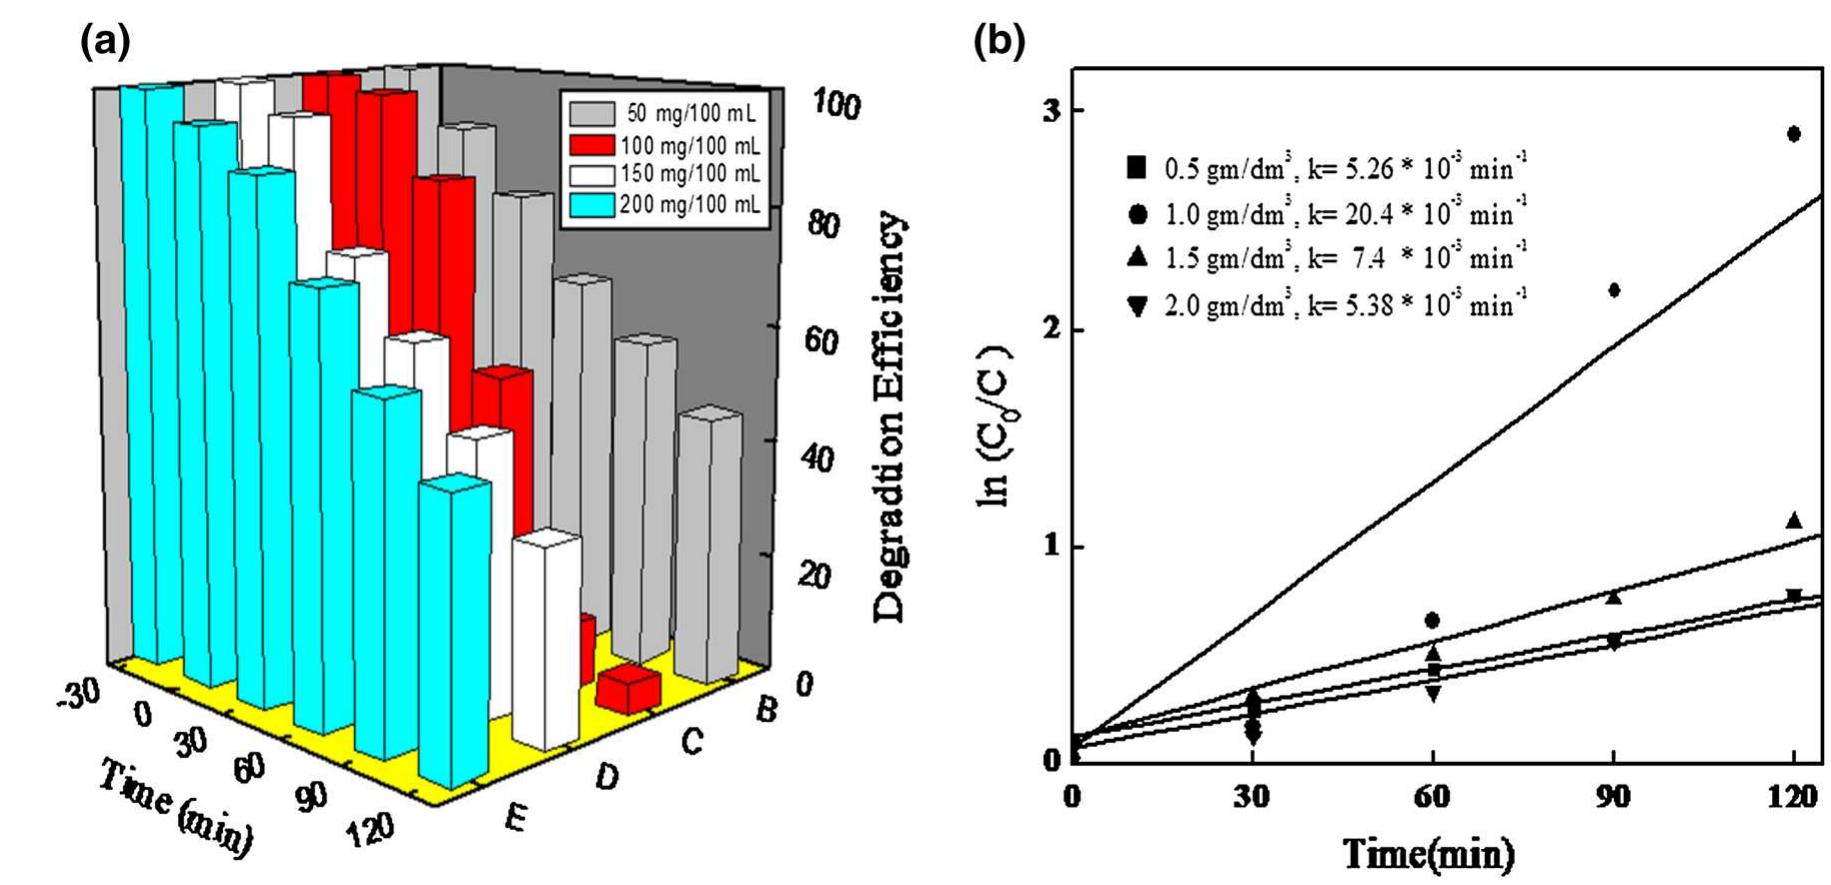
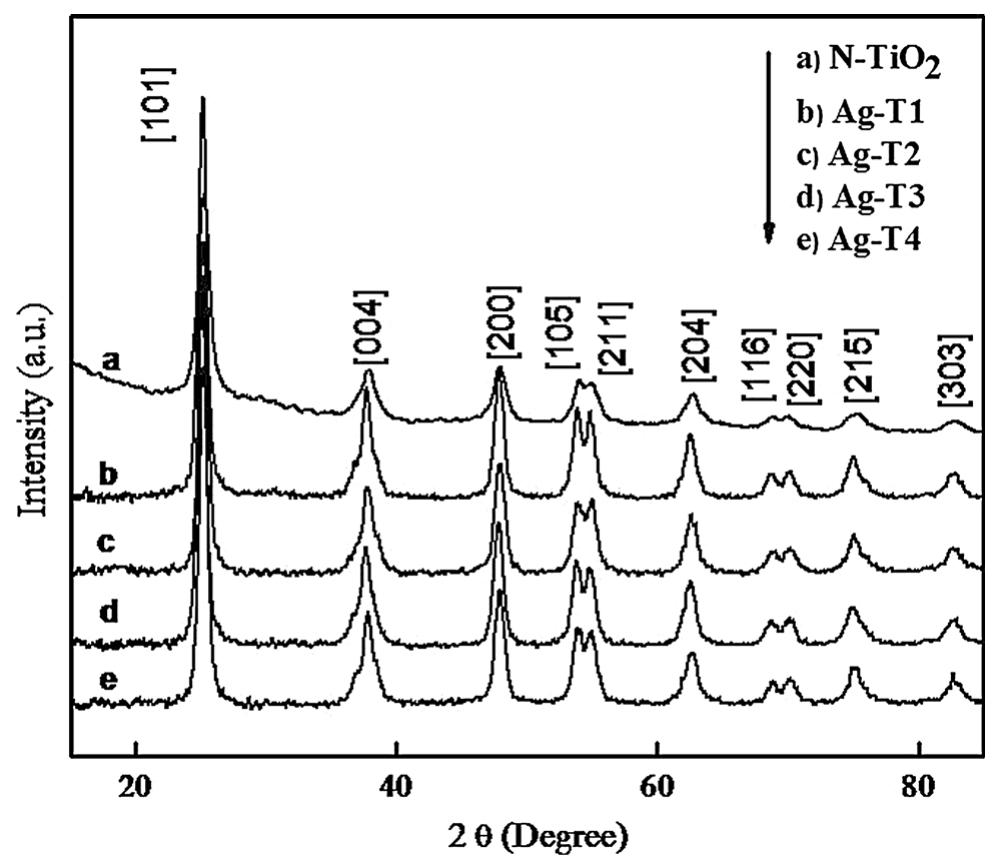
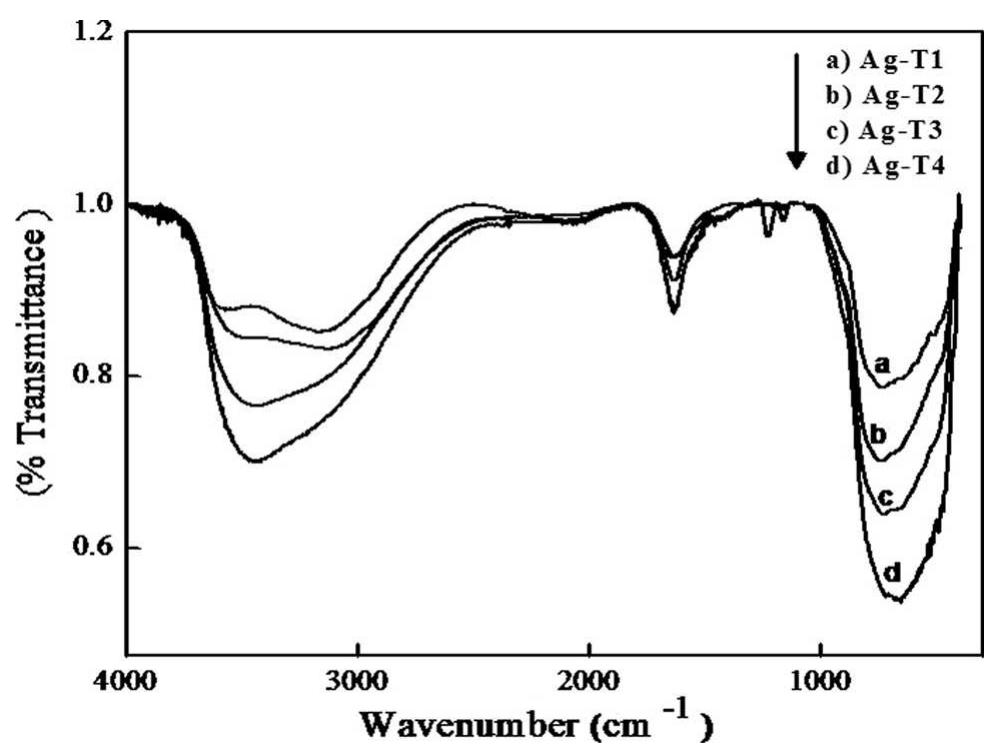
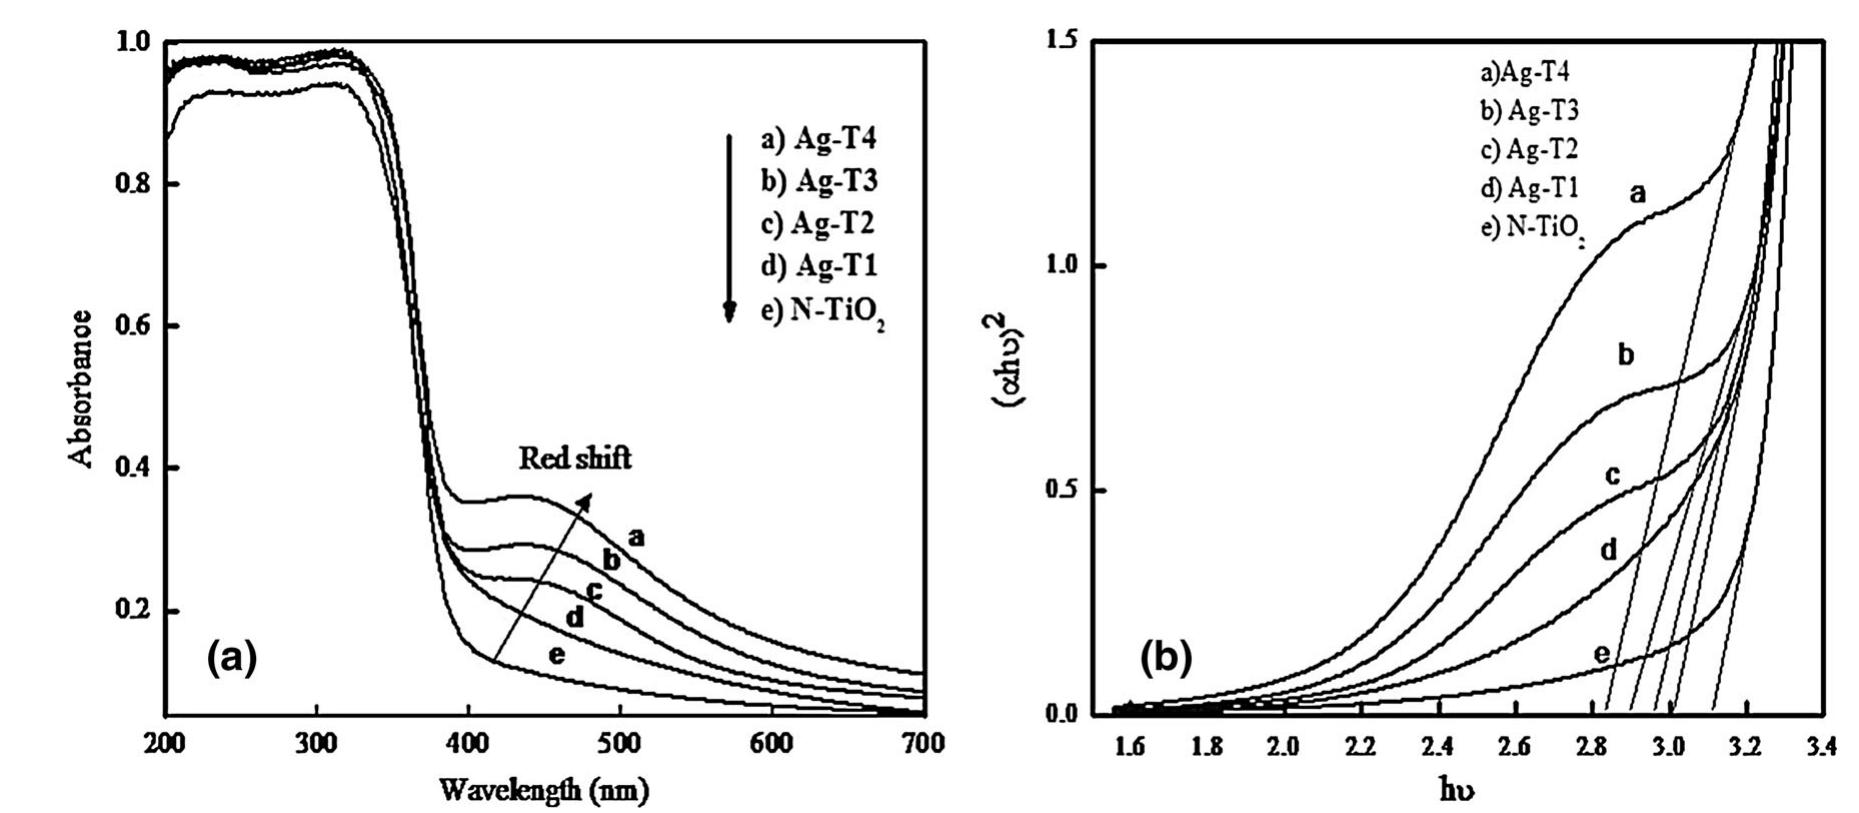
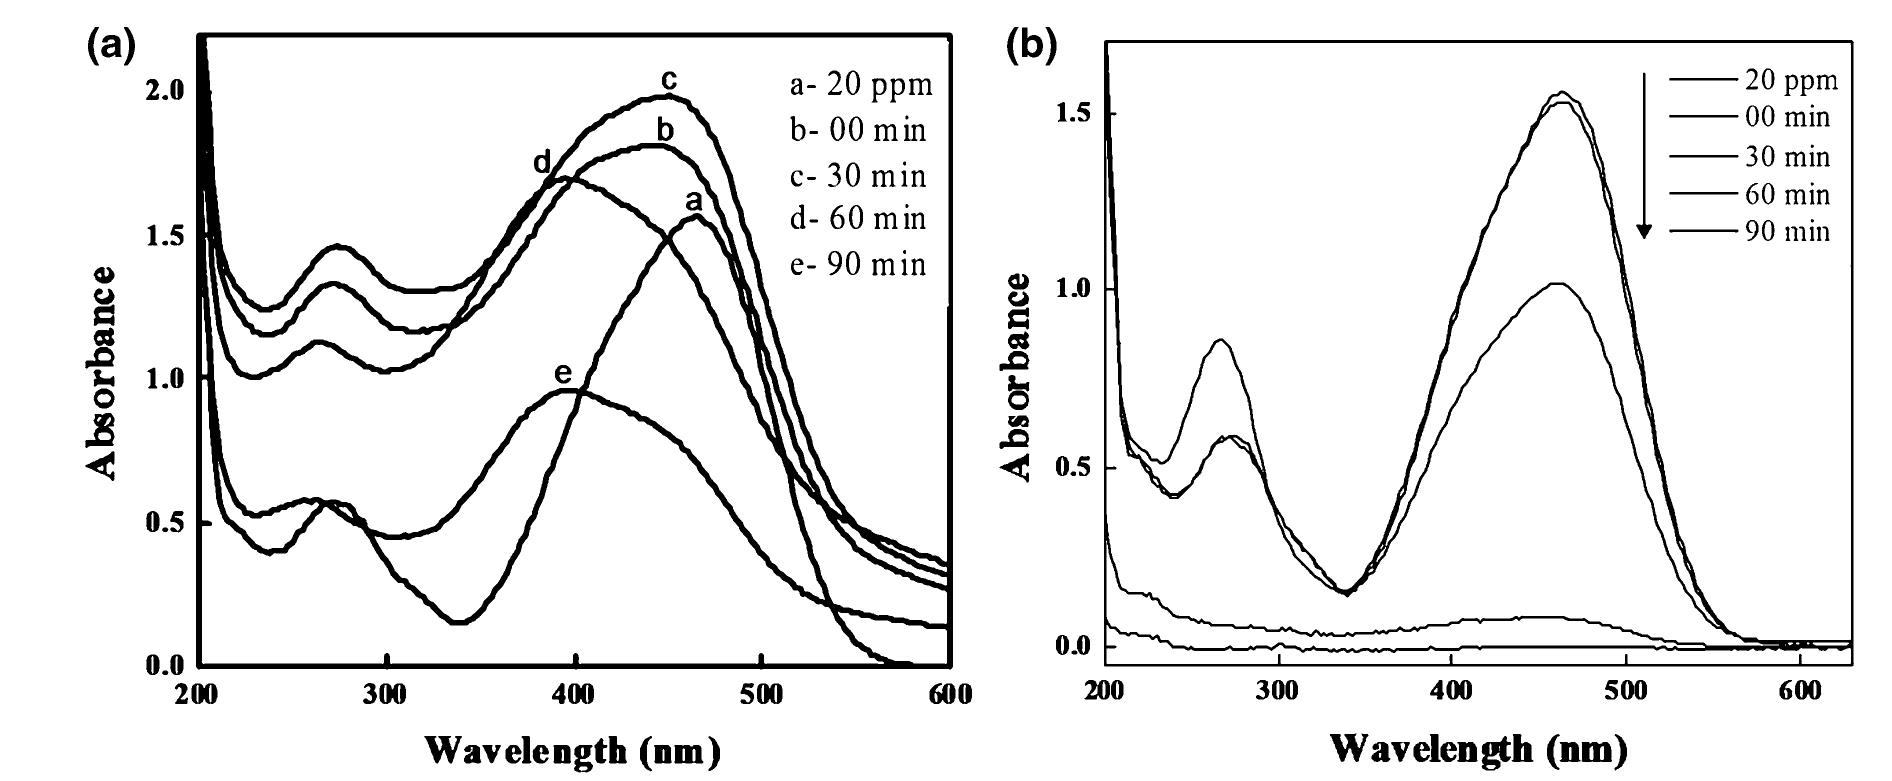
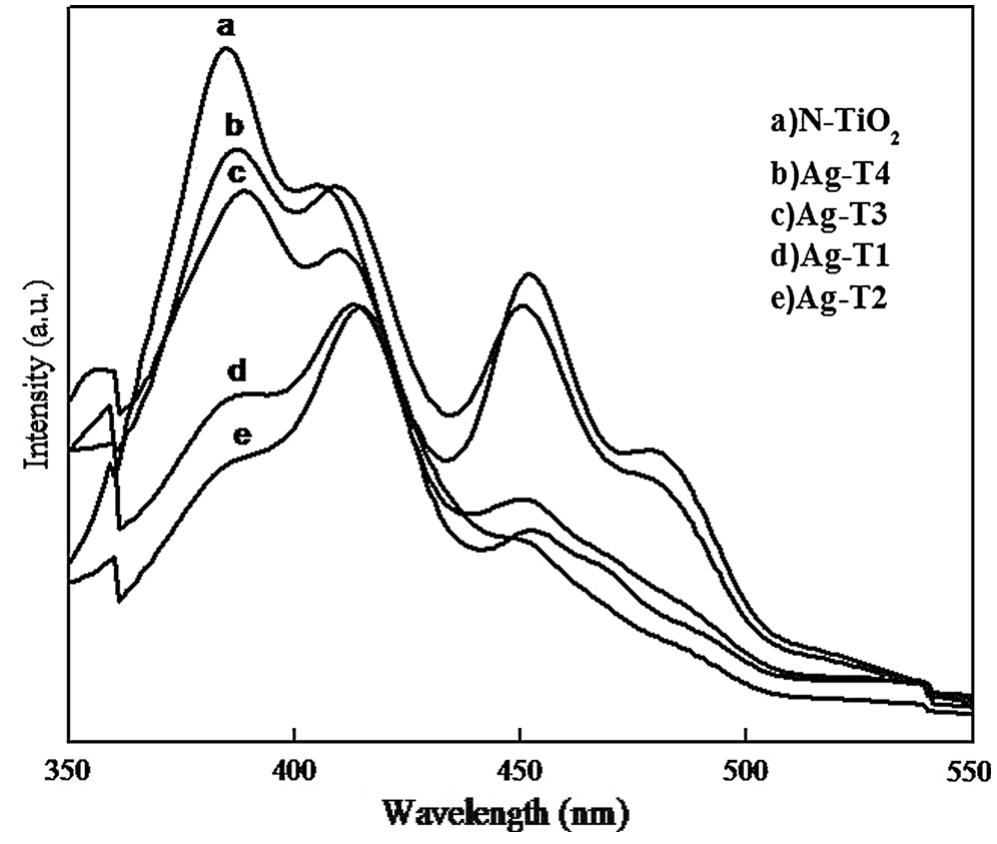
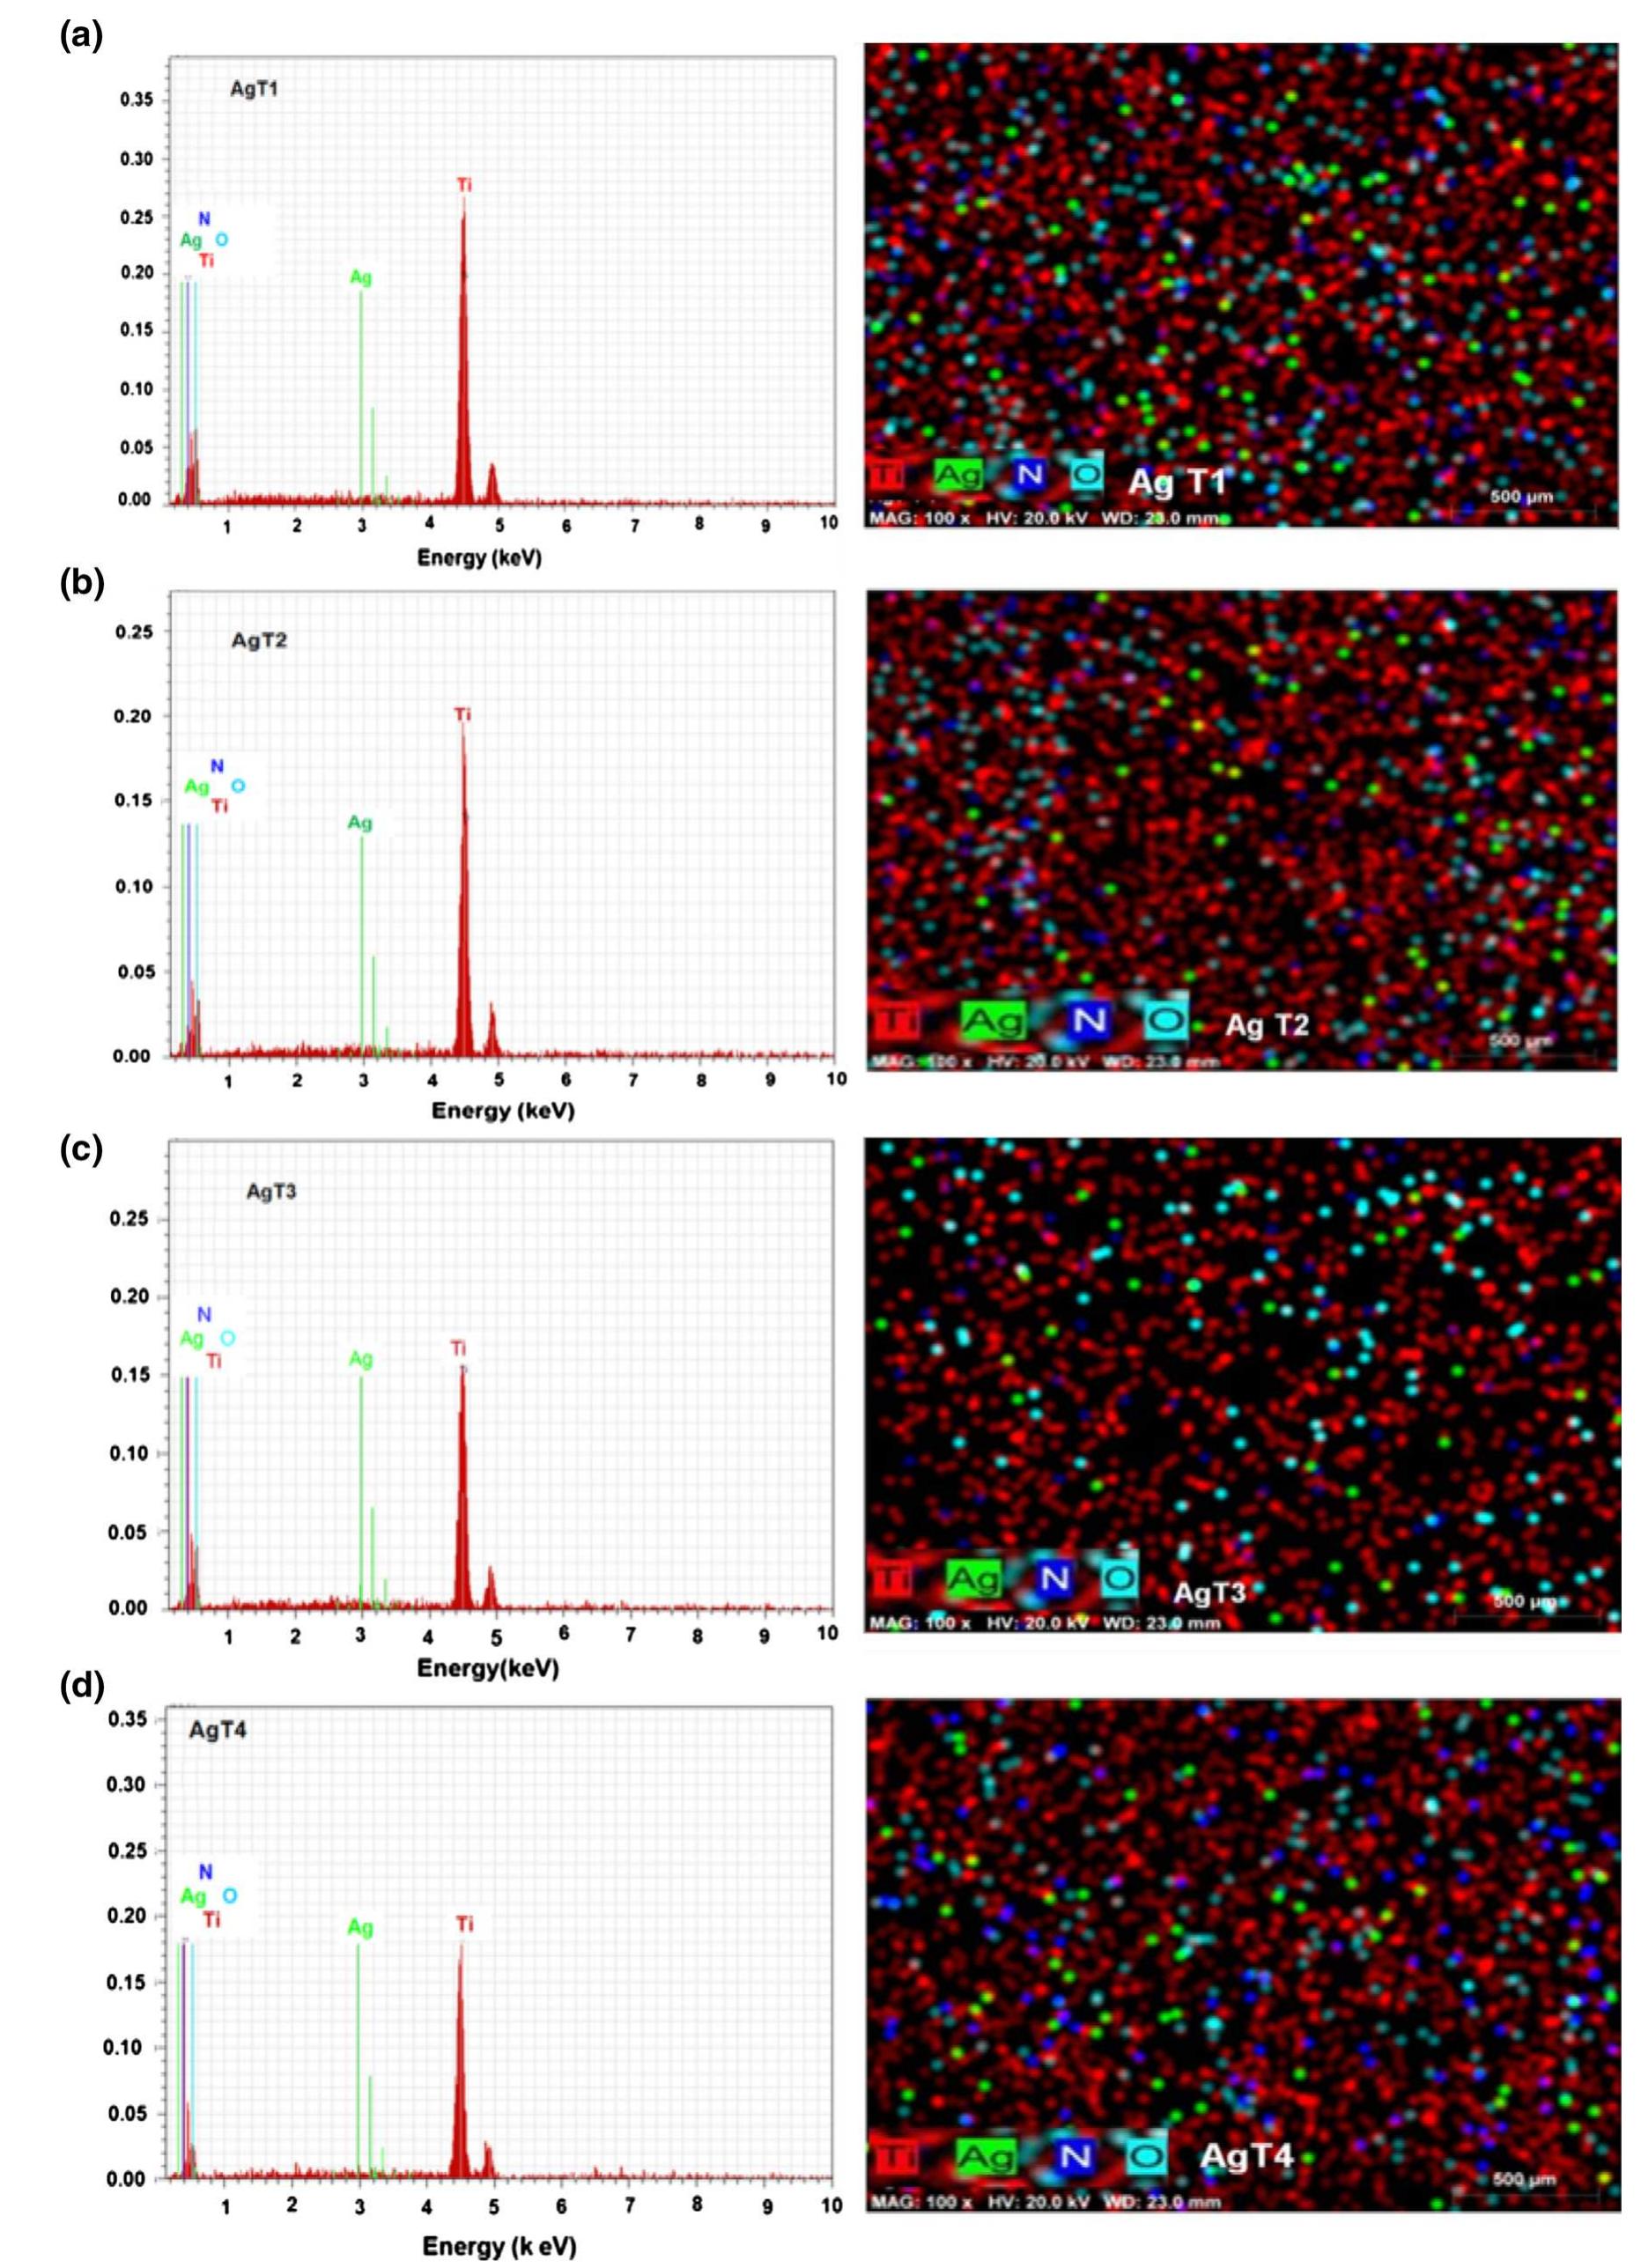
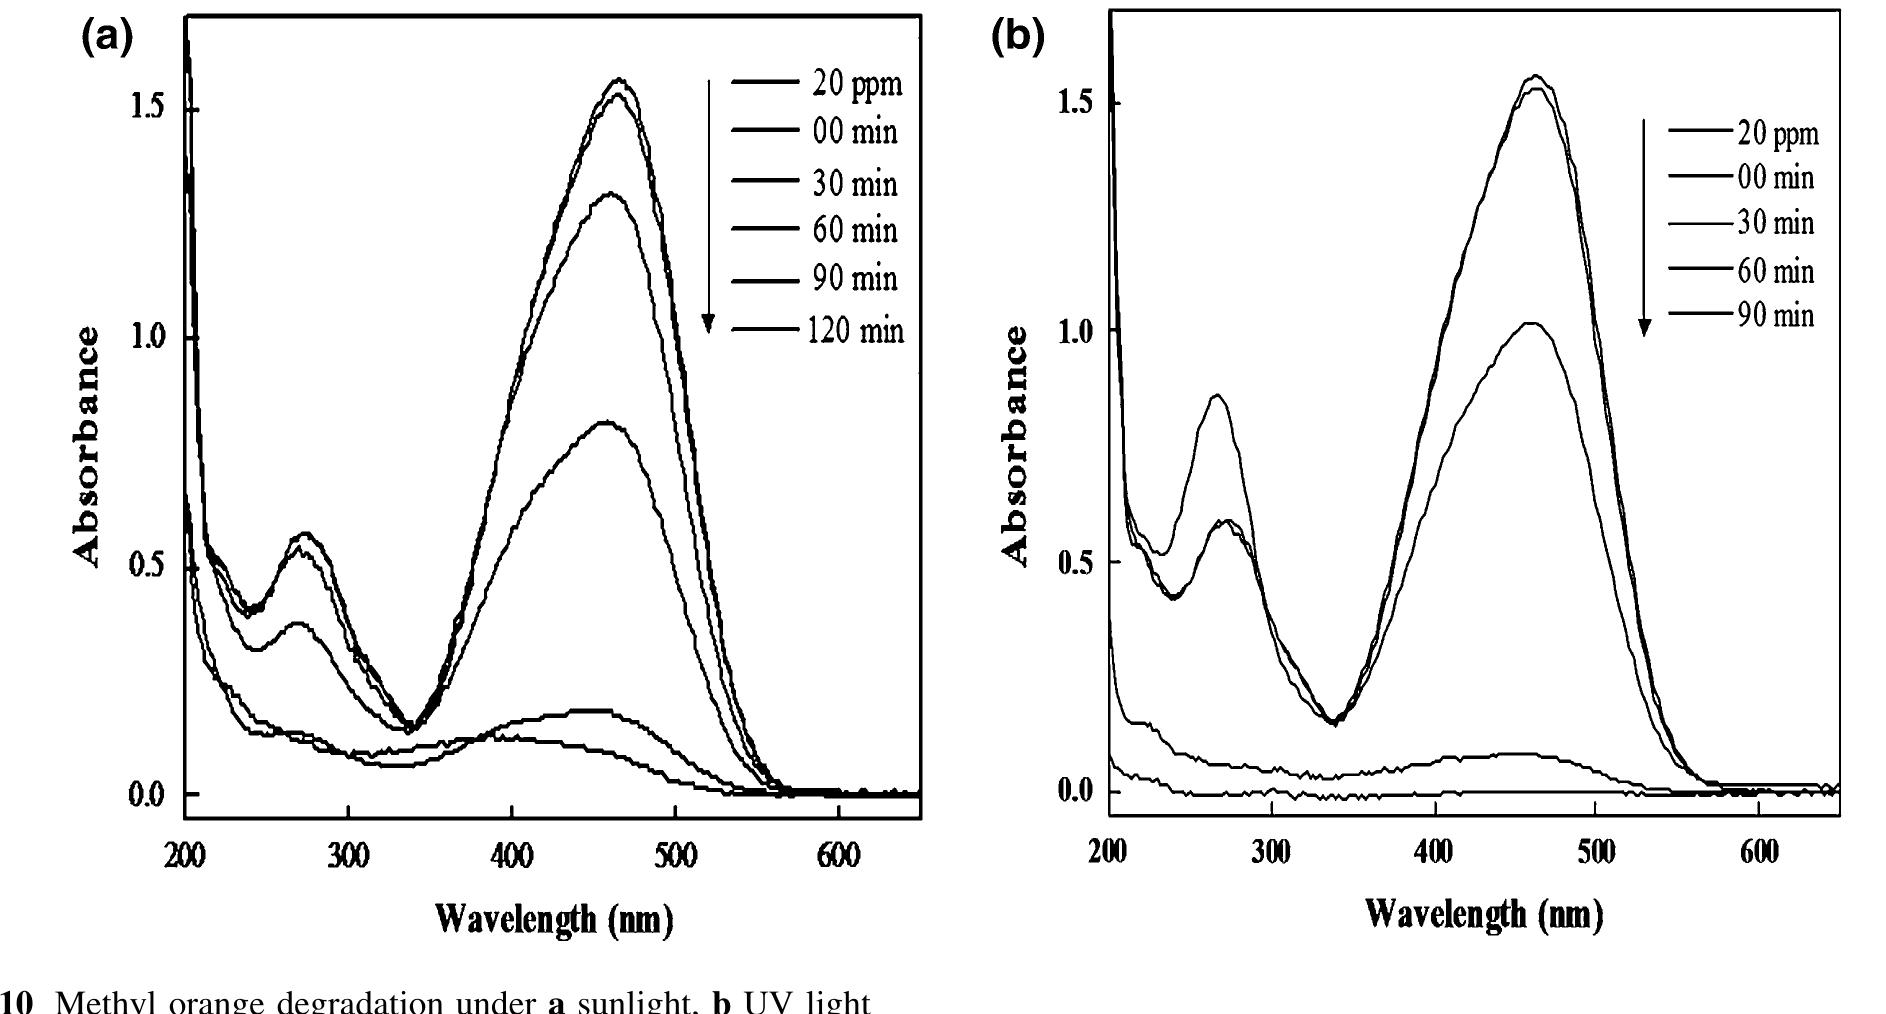
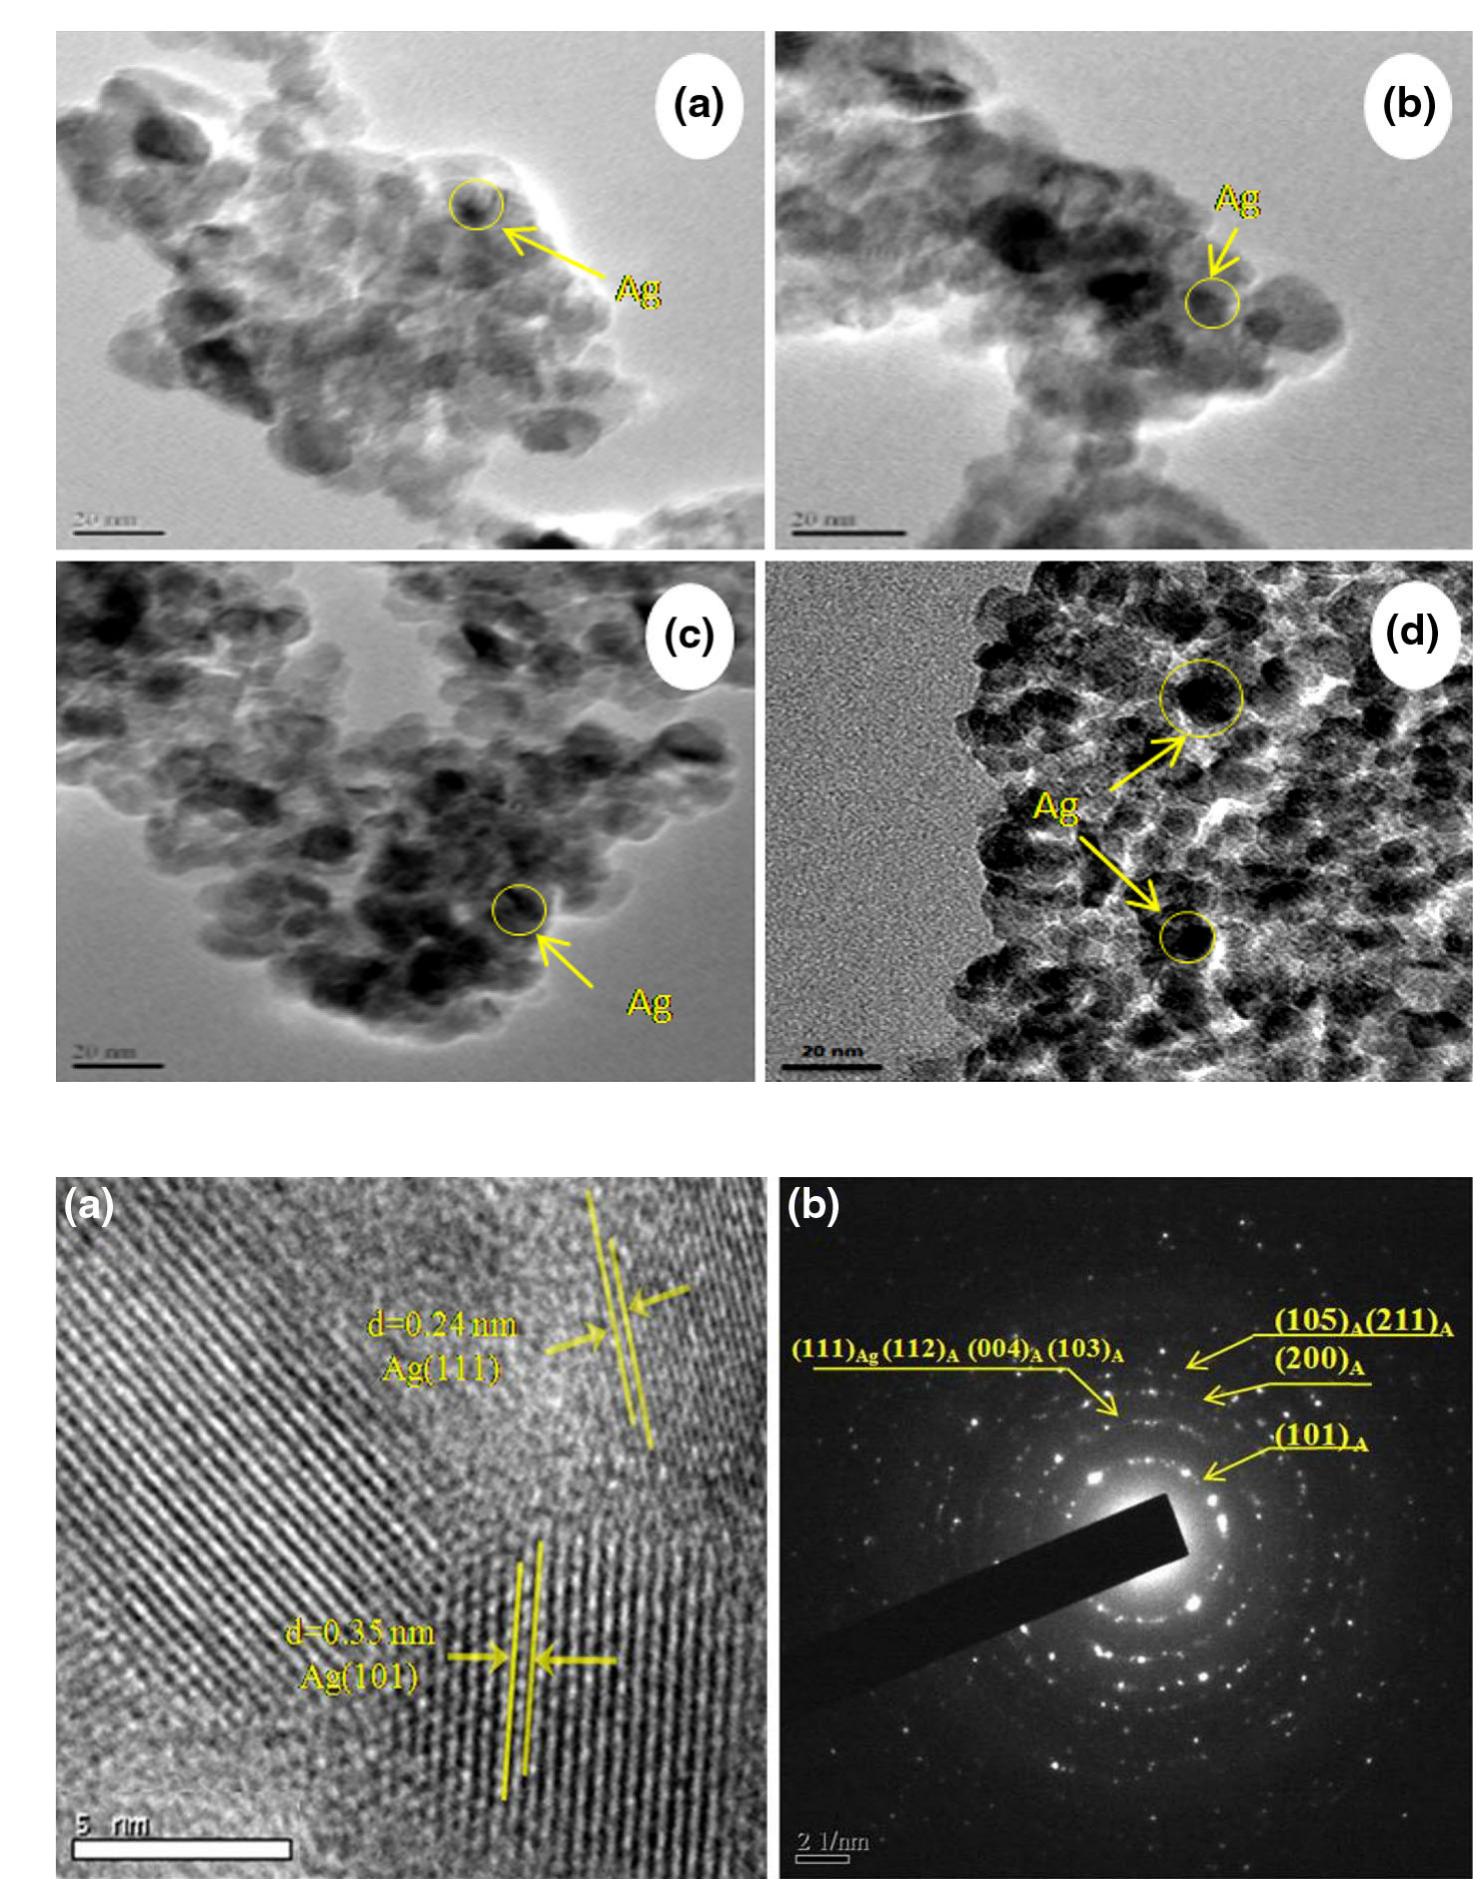
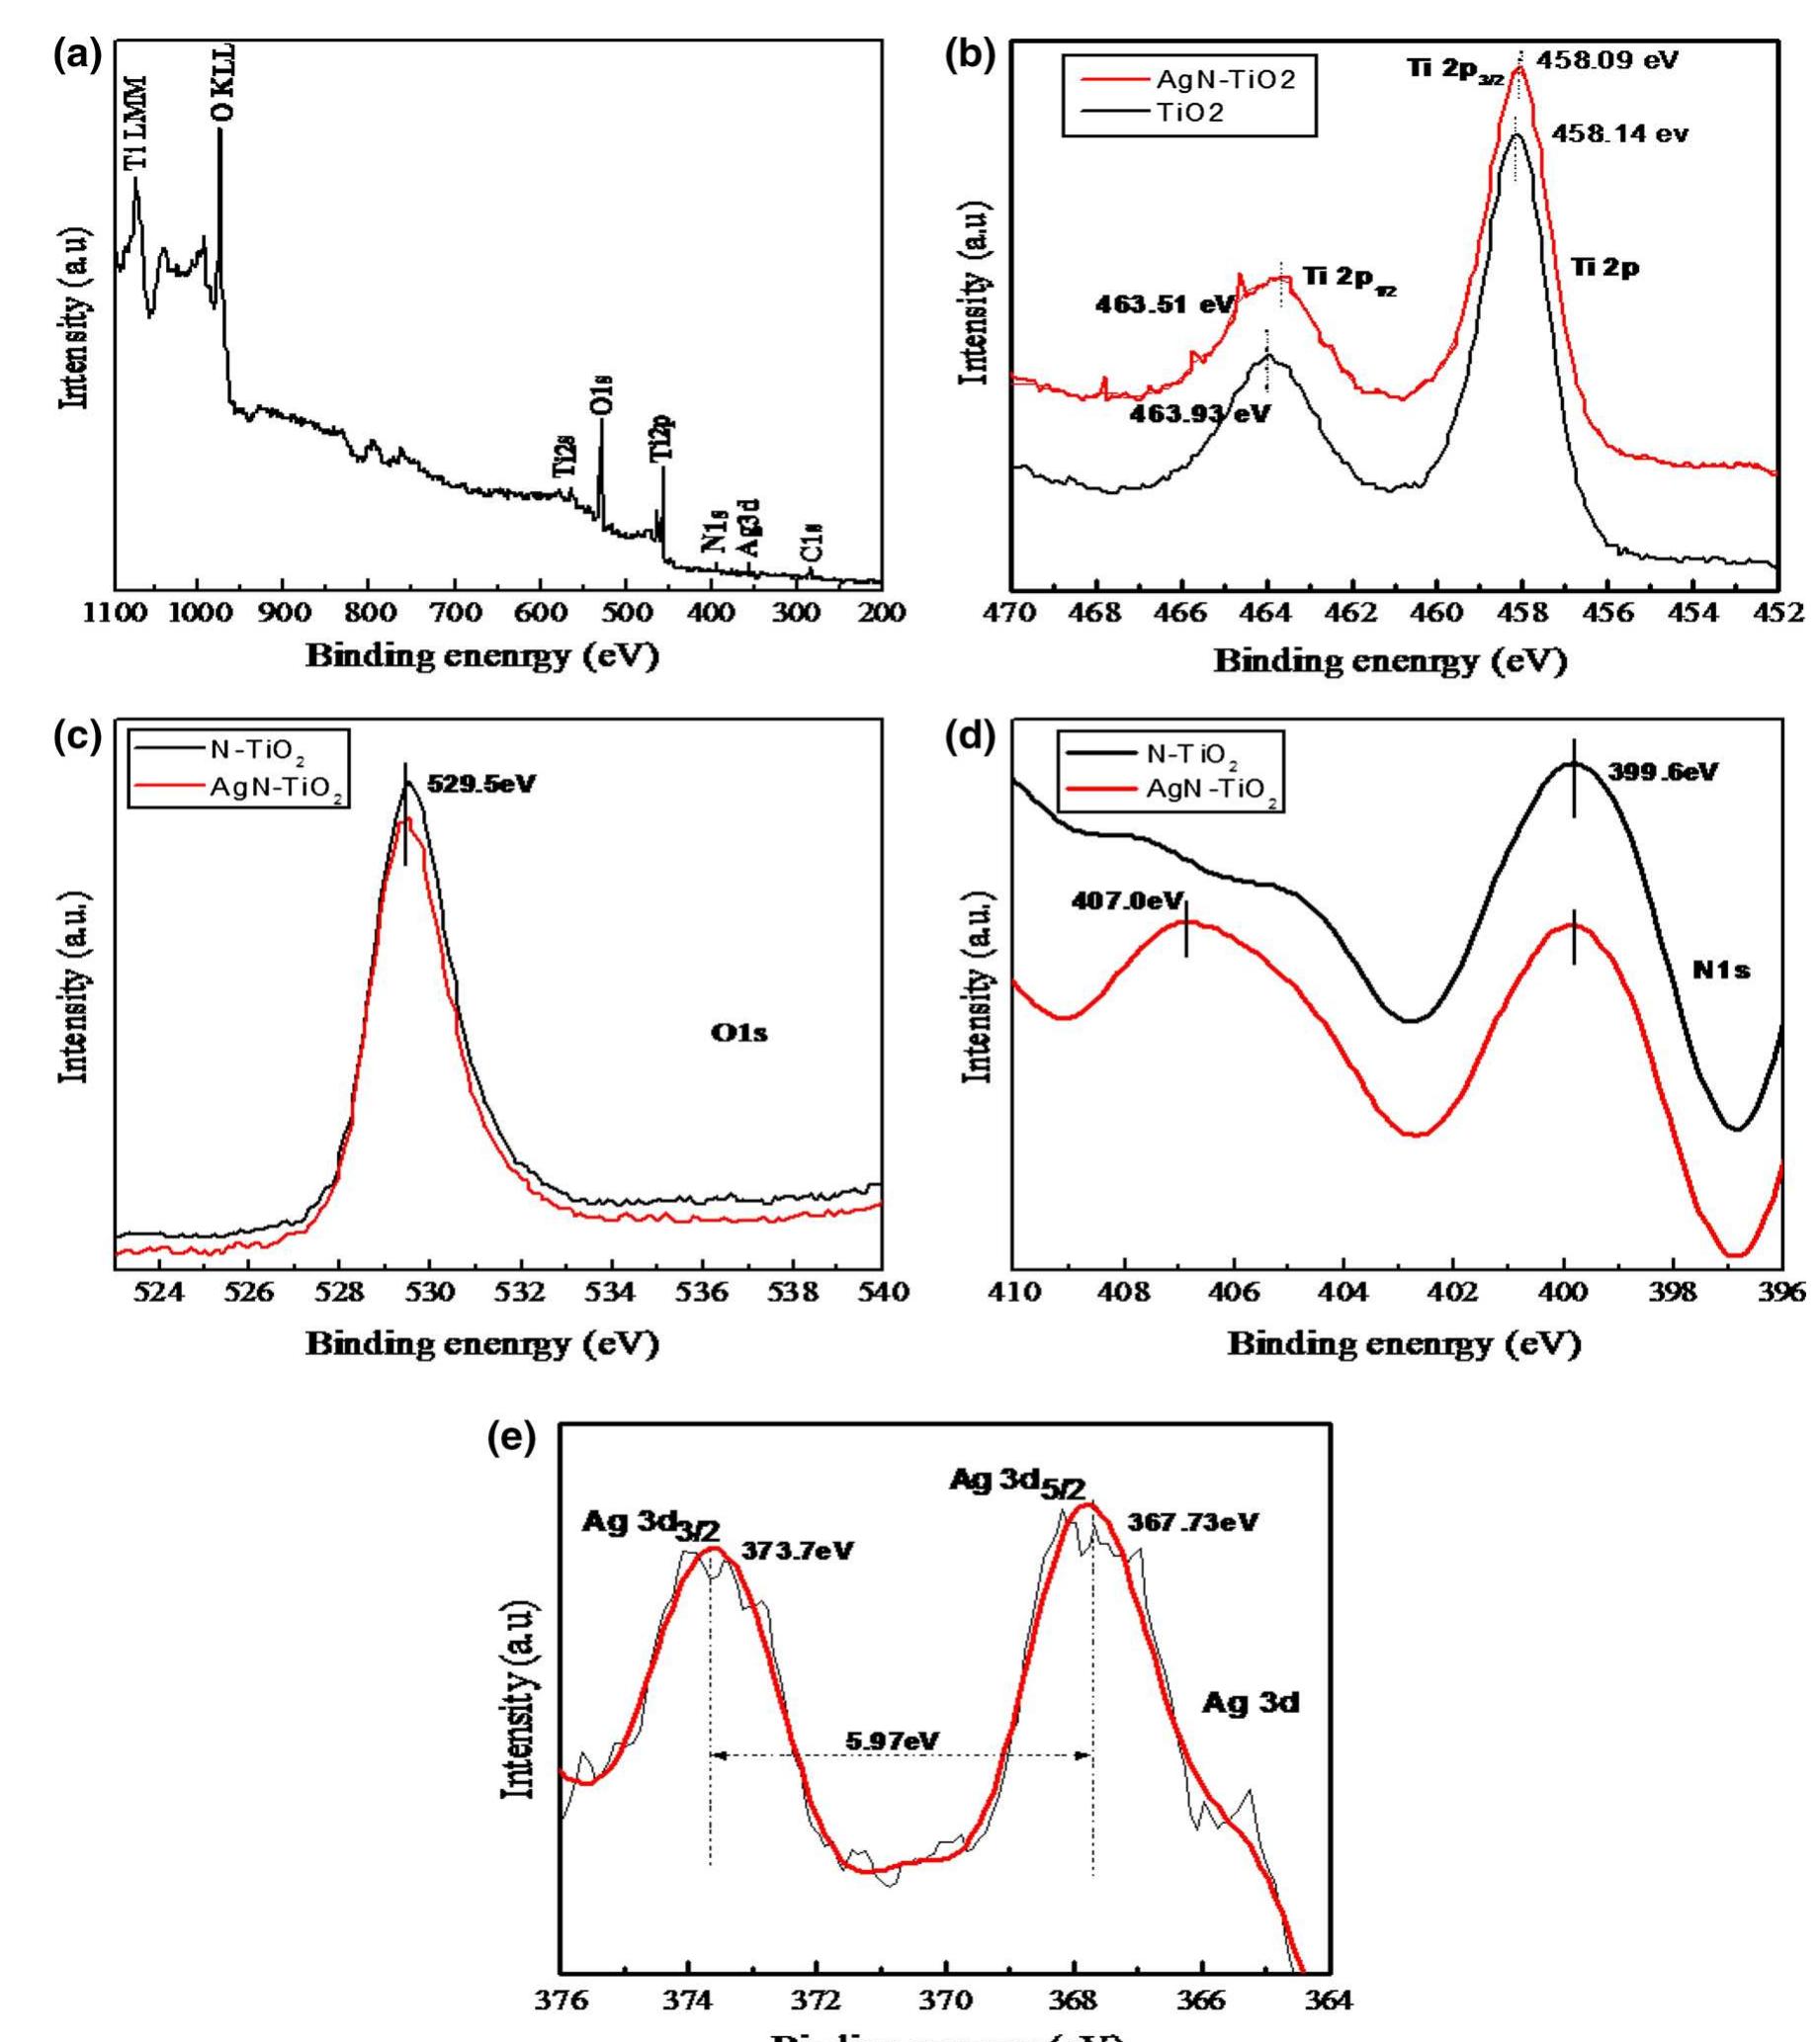
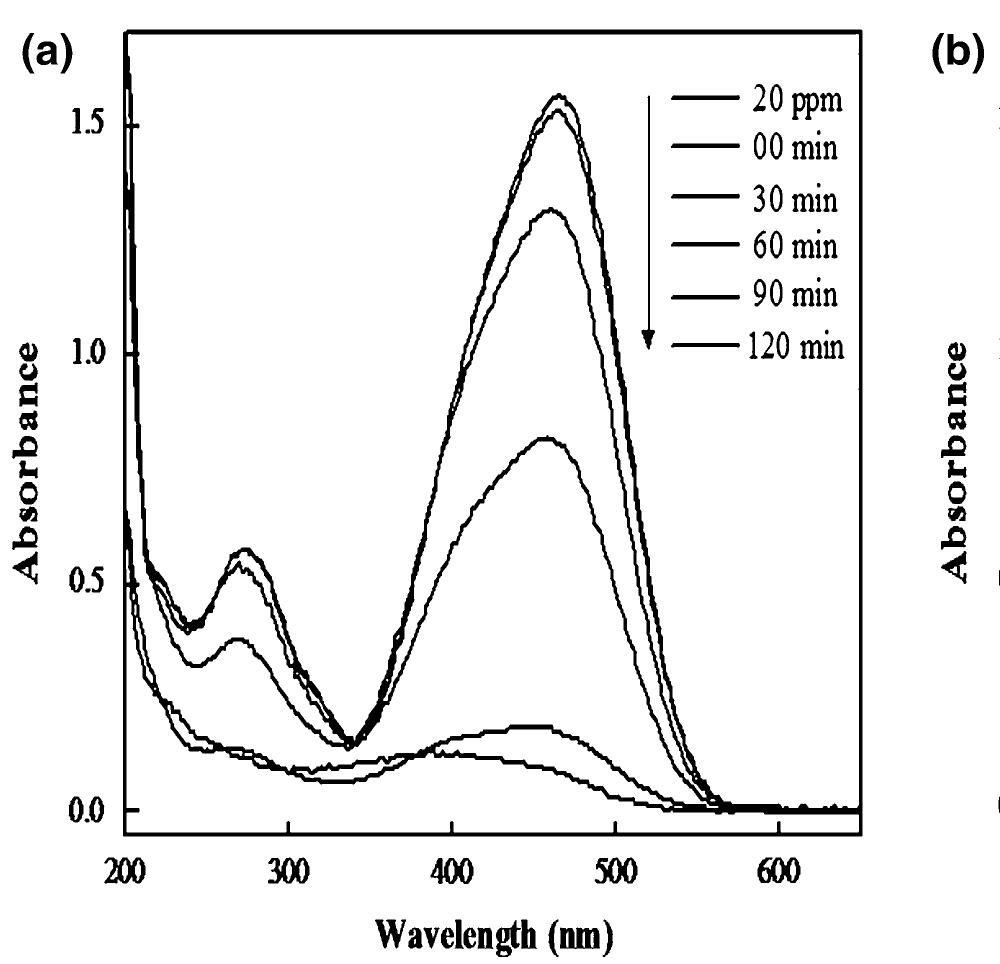
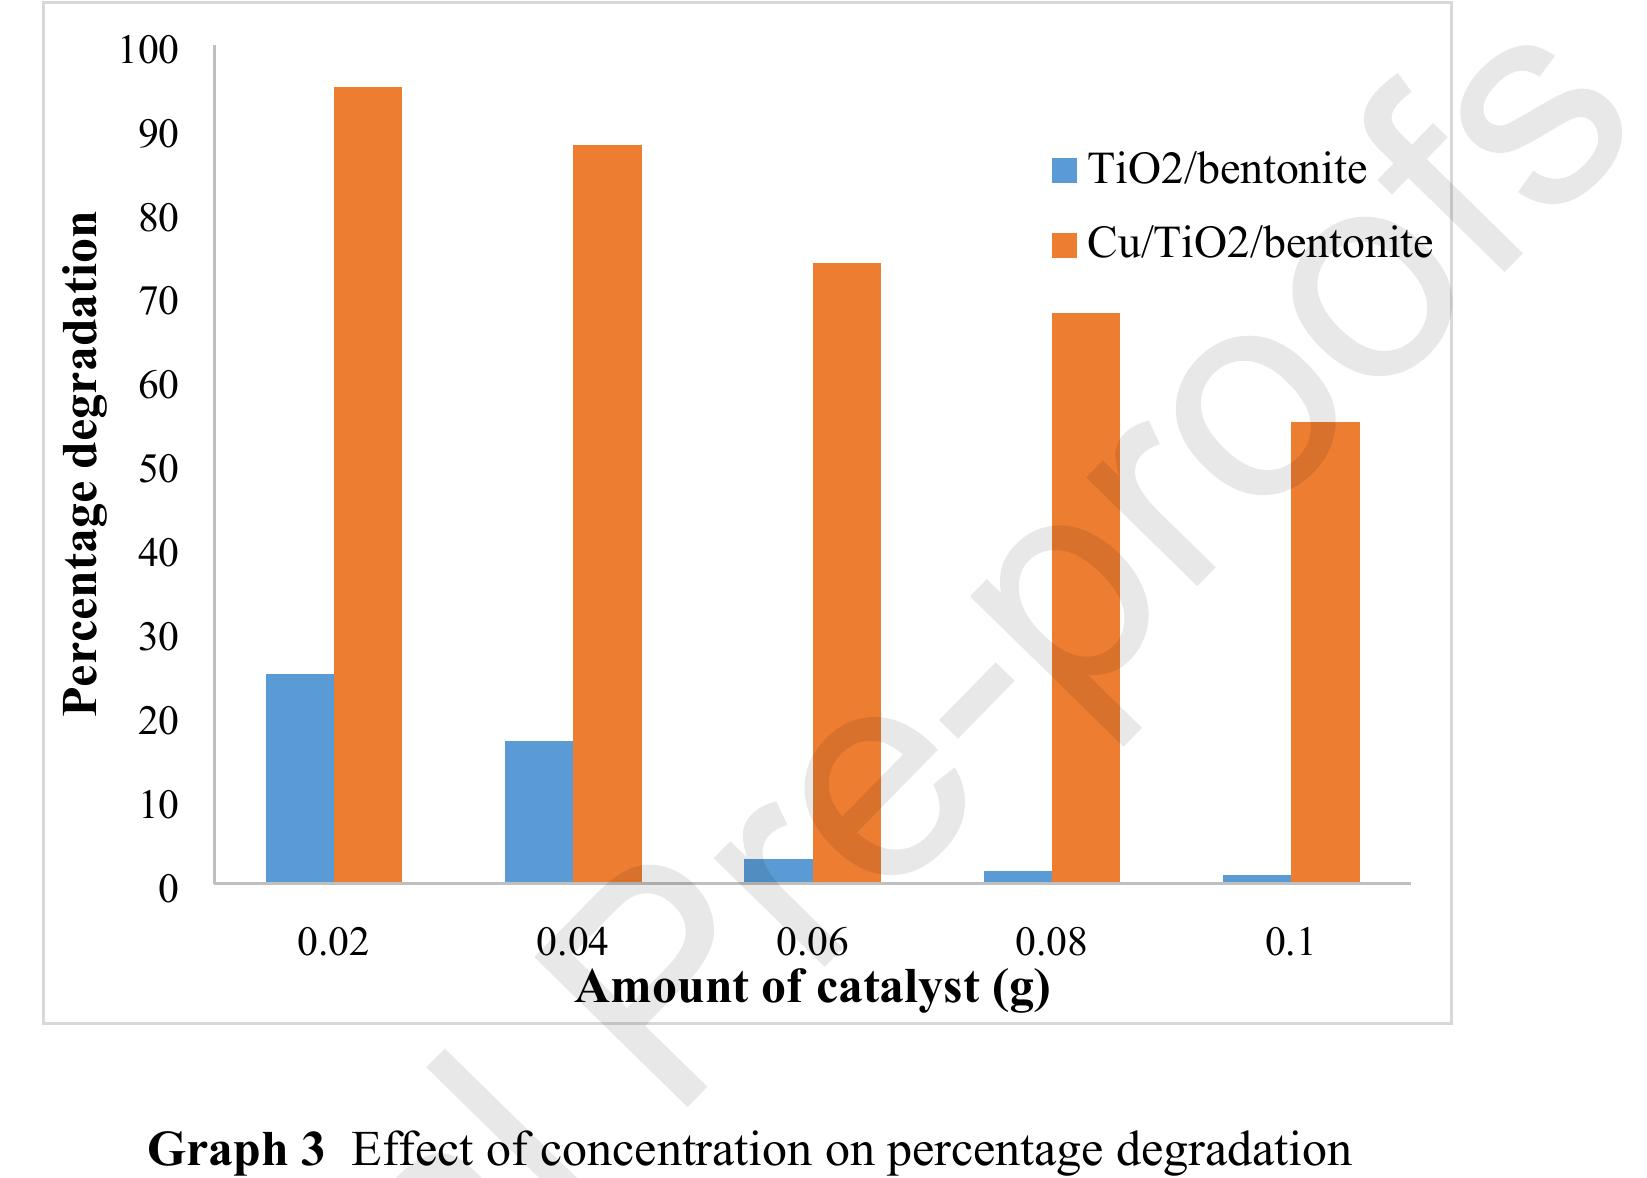
![of catalyst due to this active sites on the catalyst surface becomes unavailable for photon absorption. Another reason for the decreased degradation is turbidity of suspension [45], which causes scattering effect [46]. This is attributed to the inhibition of photon absorption by surface of Ag loaded N-doped TiOz nanocomposites.](https://figures.academia-assets.com/108040360/figure_009.jpg)


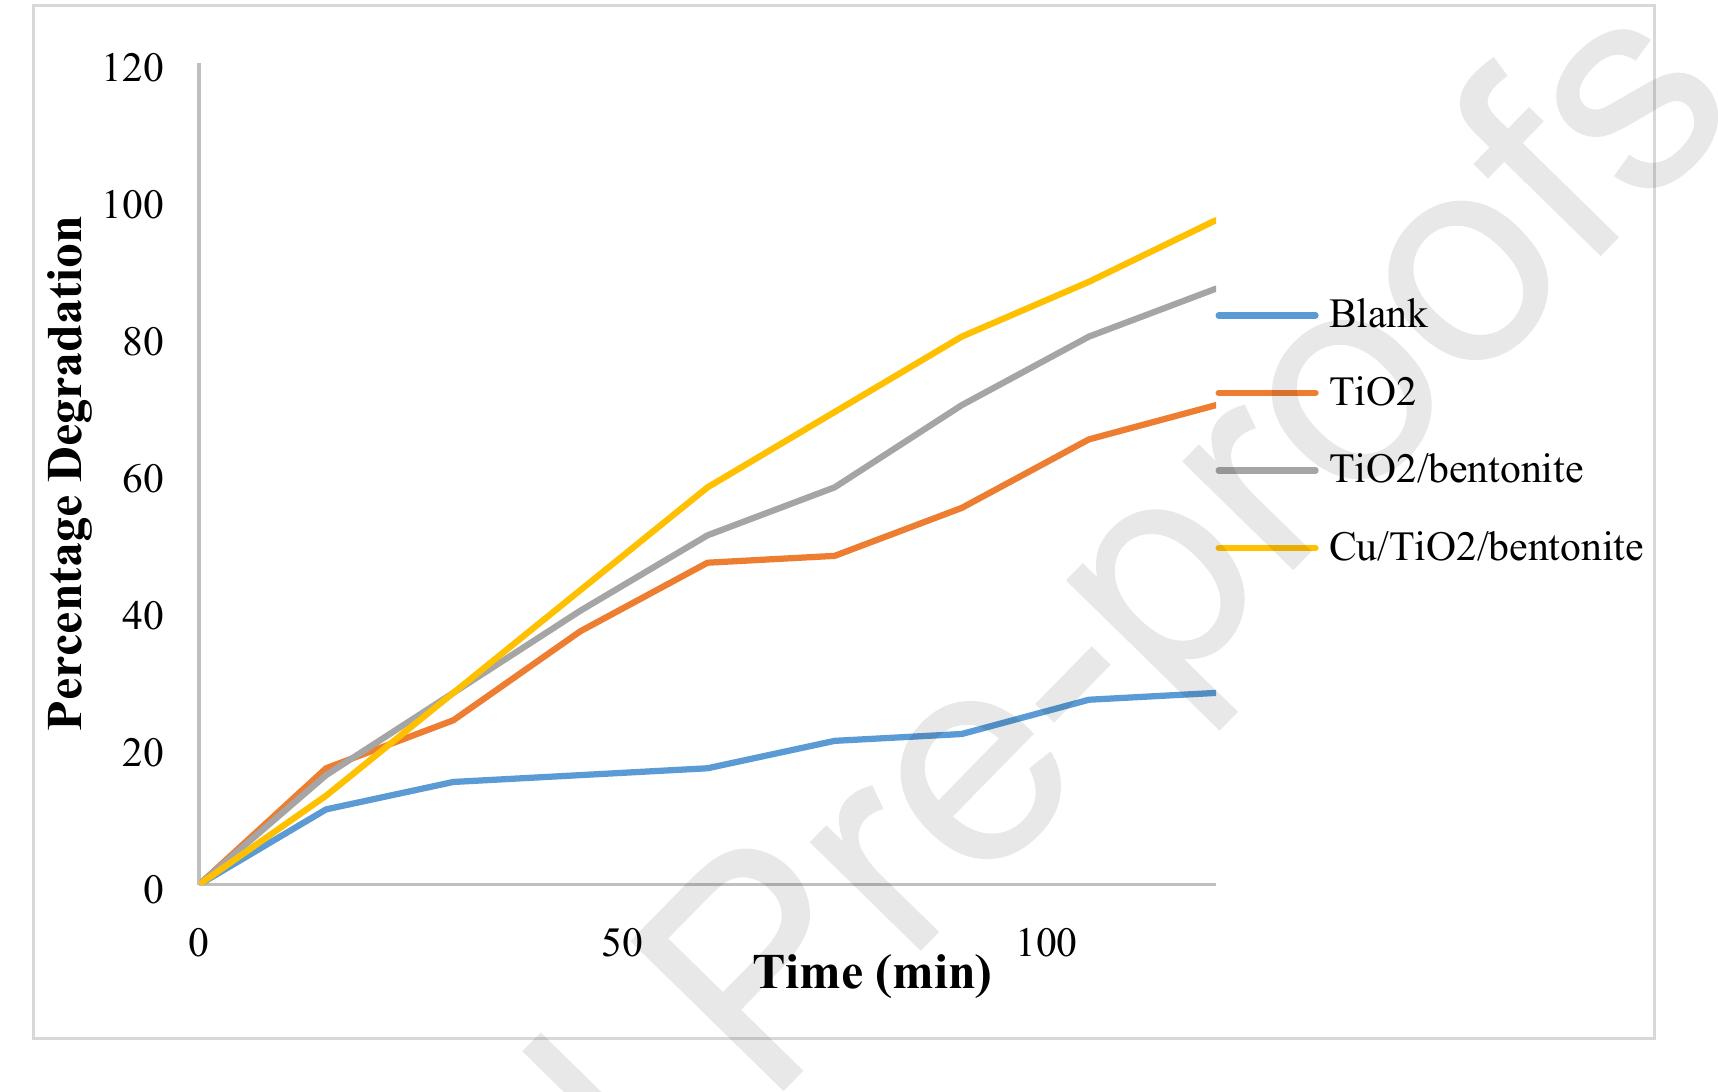
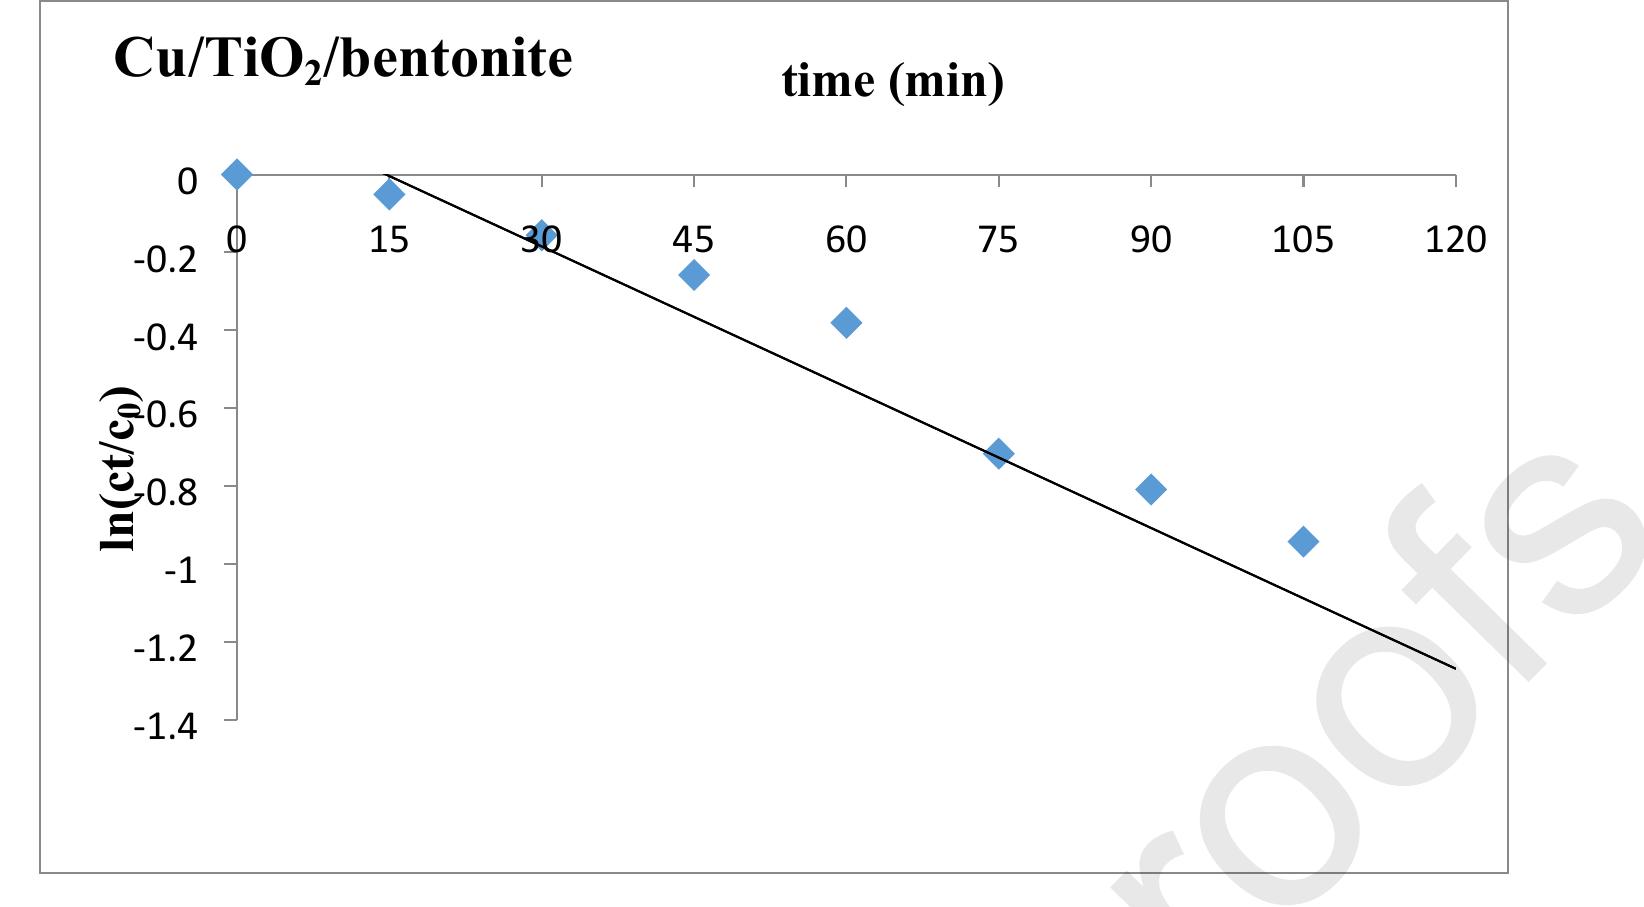
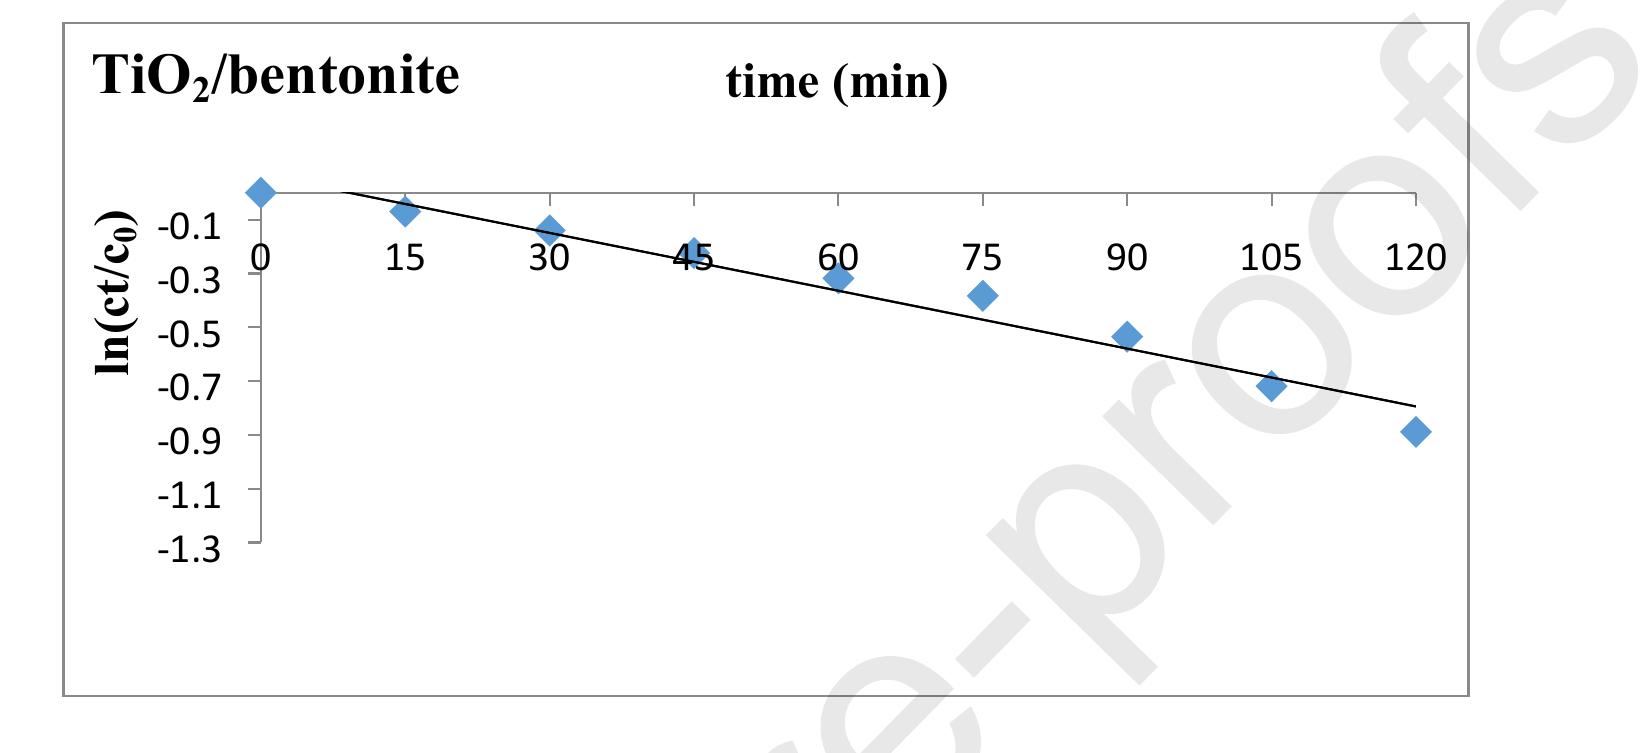
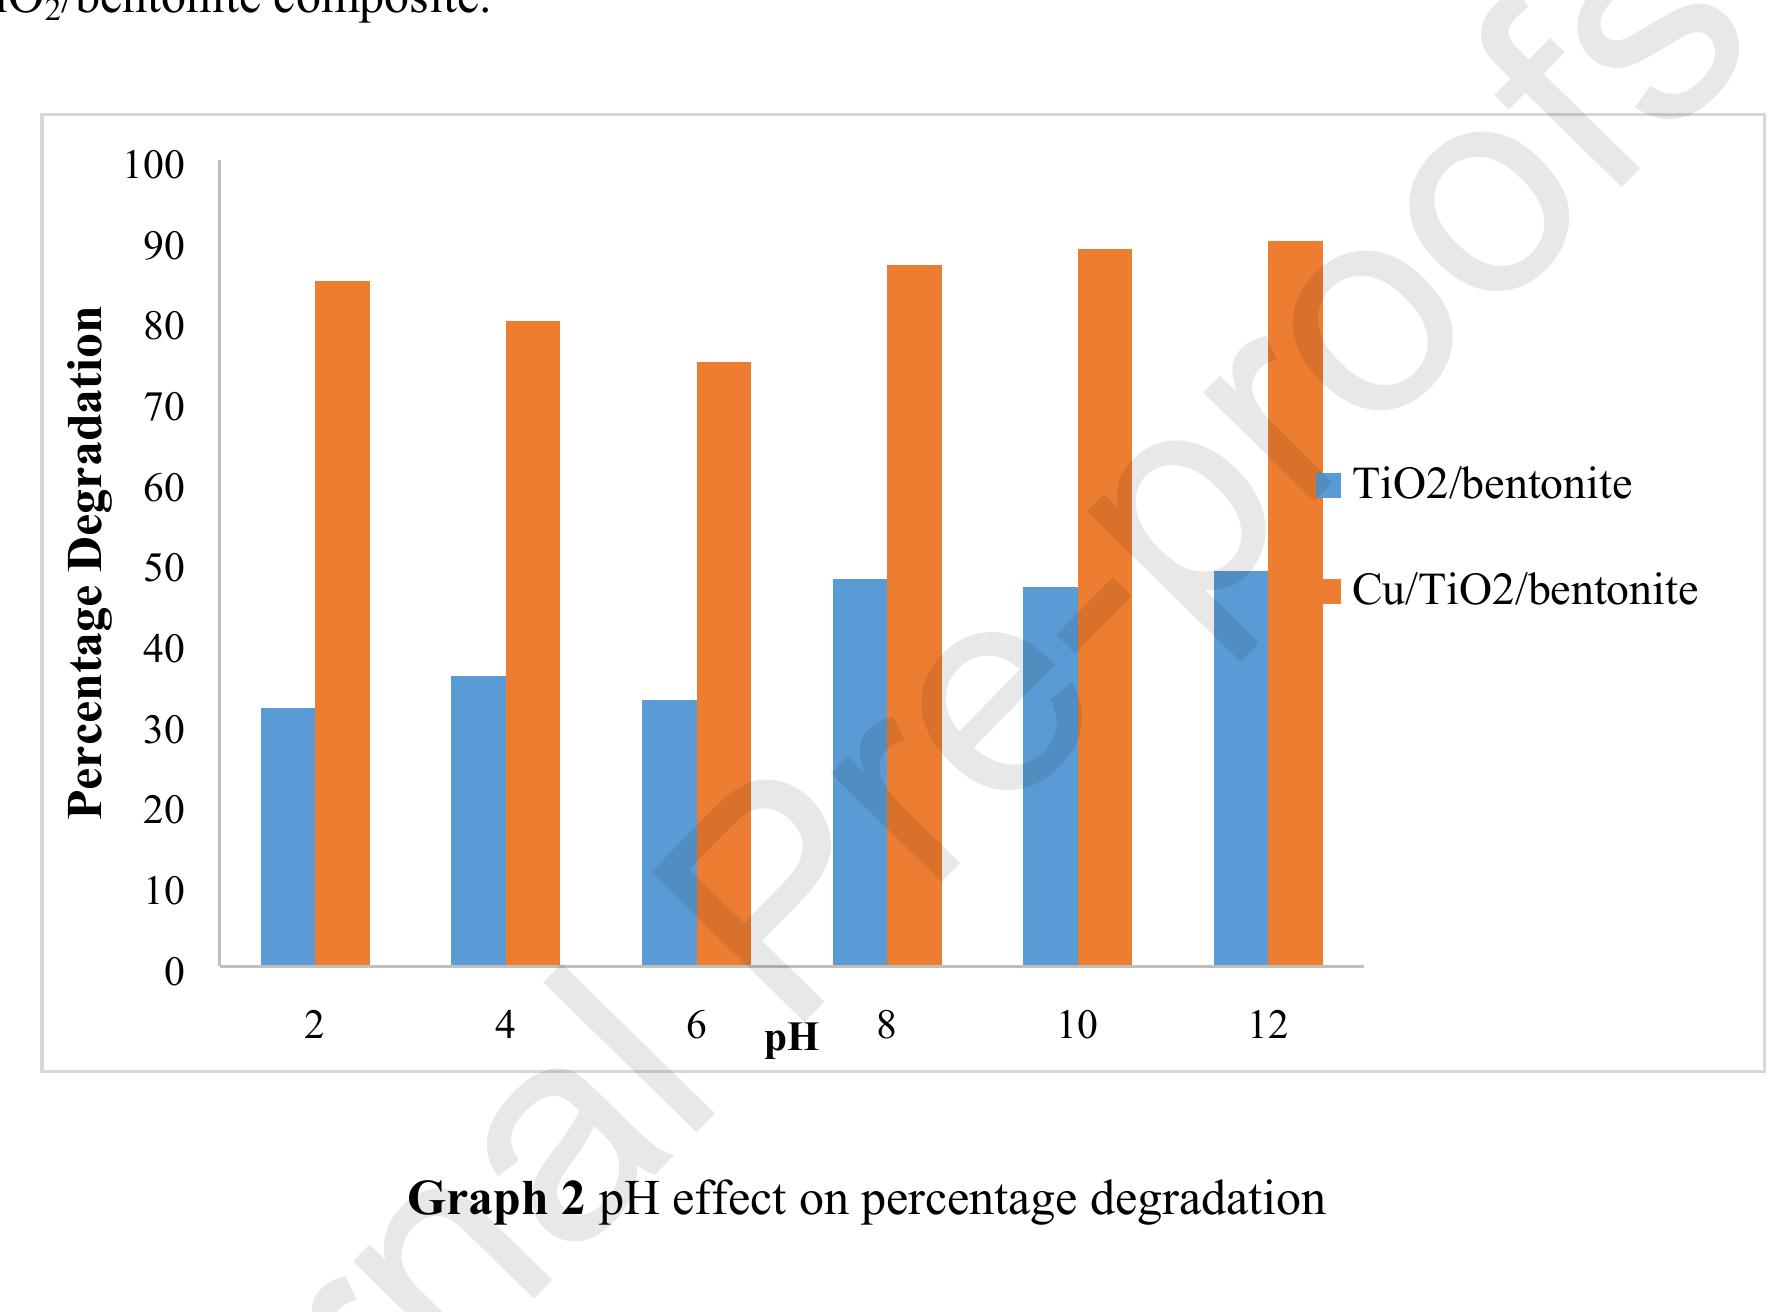
![min. Maximum degradation was achieved by using Cu/TiO2/bentonite composite after 120 Percentage Degradation = [Ag- A; / Ag] x 100](https://figures.academia-assets.com/102075622/figure_007.jpg)


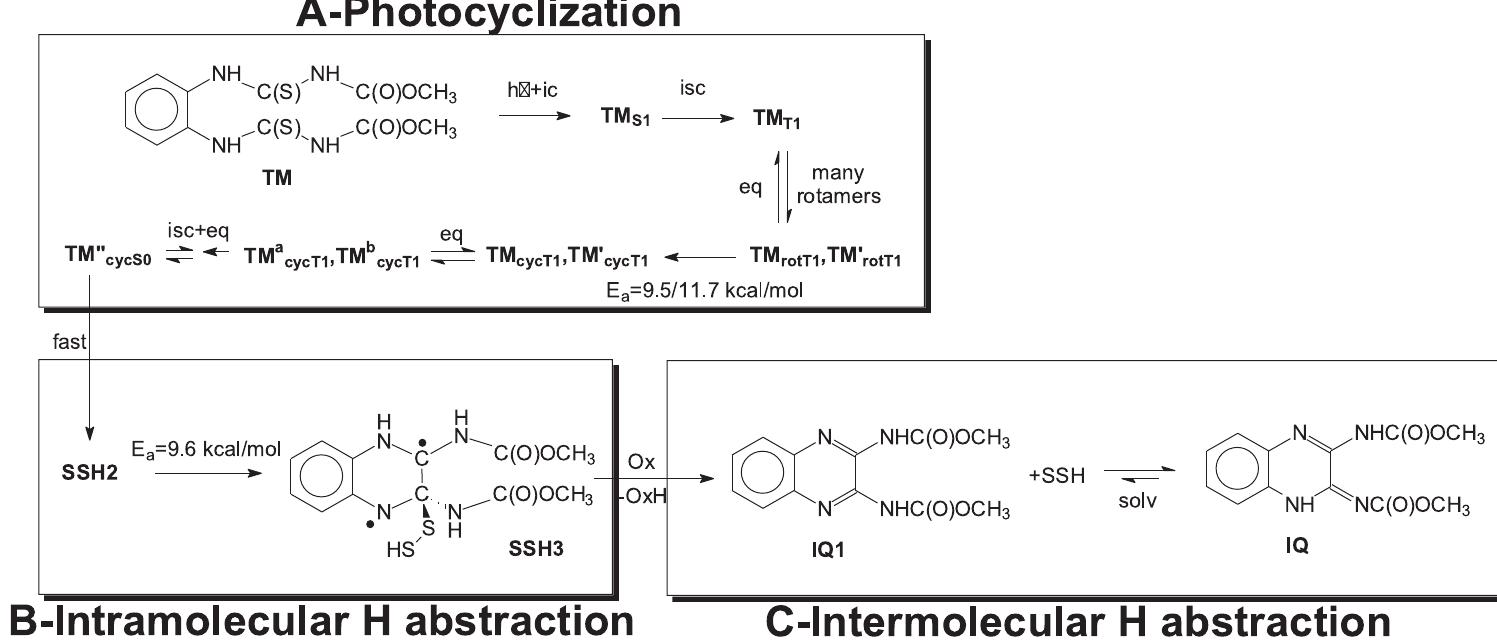
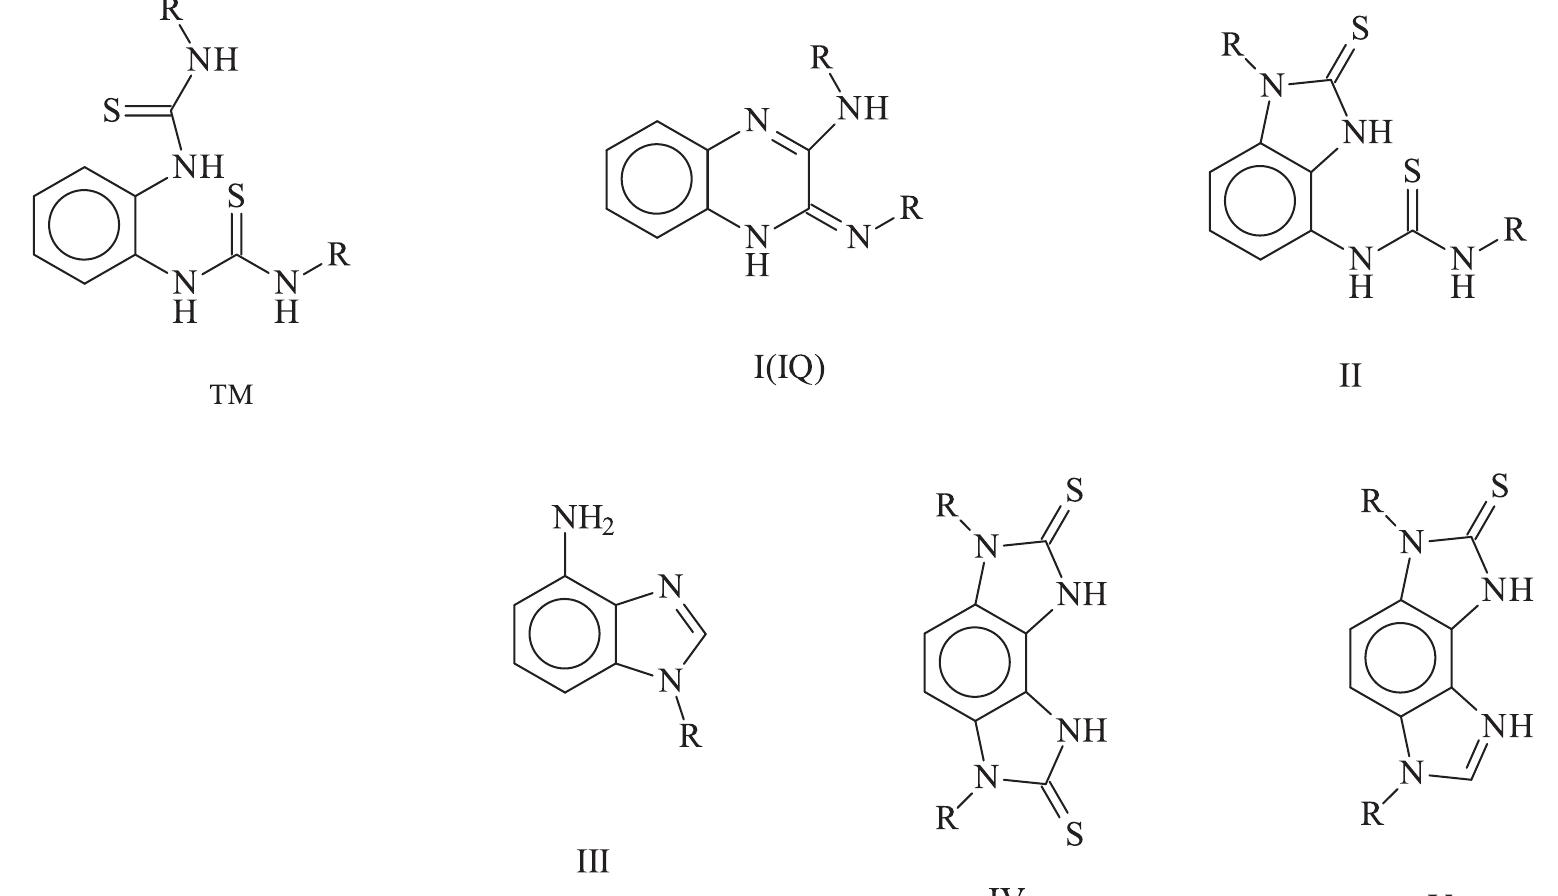
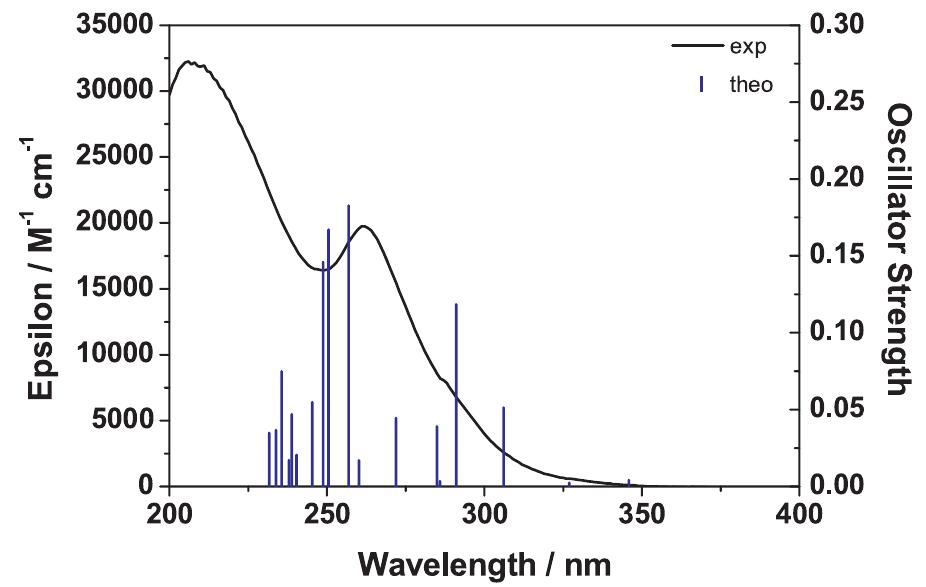
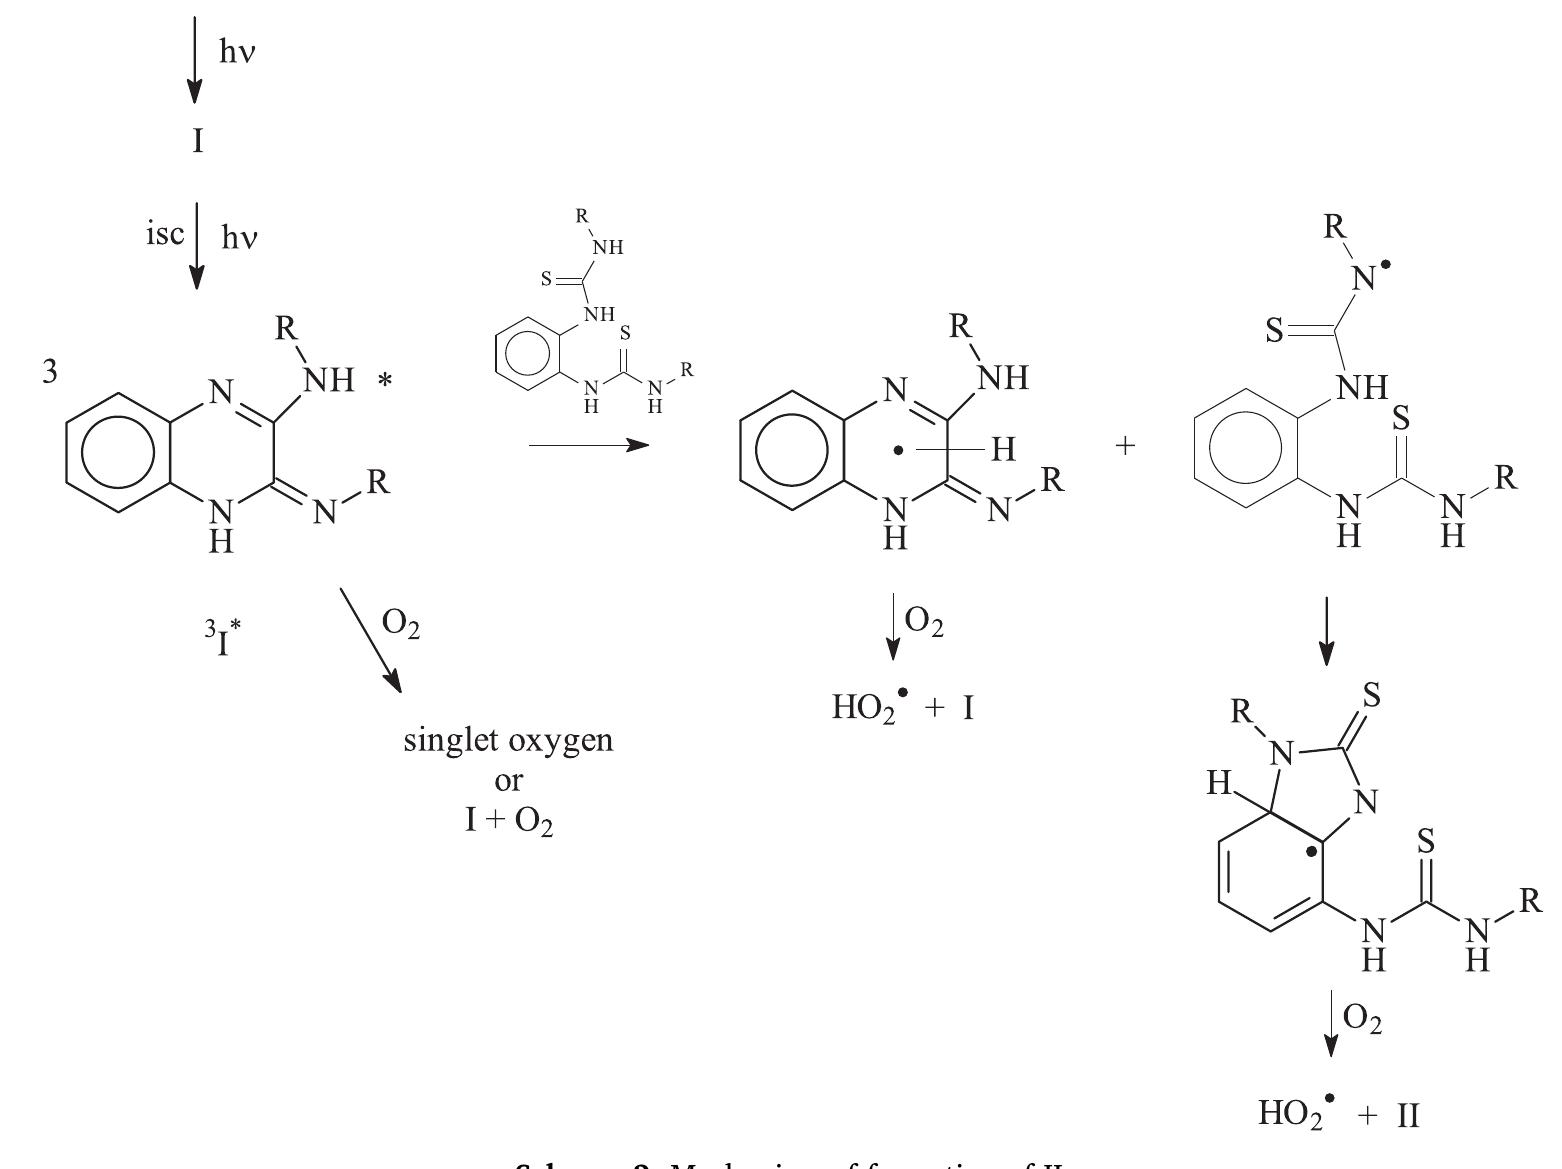
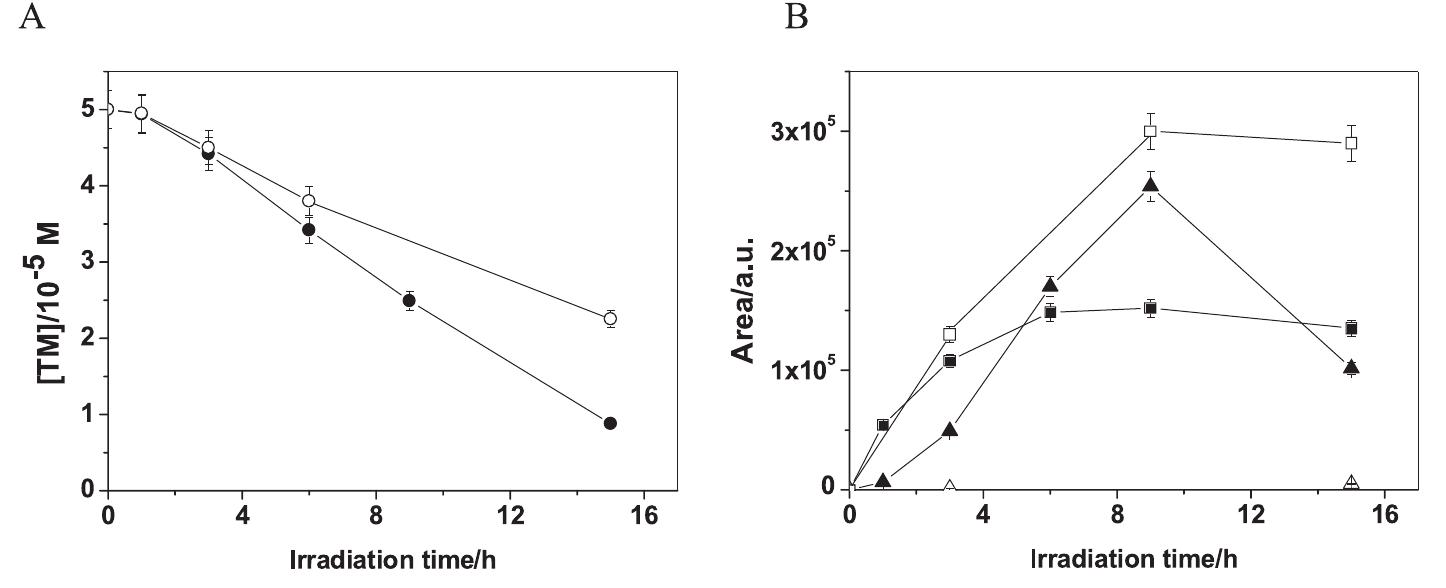
![Fig. 1. Experimental absorption spectrum of TM in water (solid line) and the- oretical oscillator strengths calculated with TD-DFT at the B3LYP/6-31 + G(d,p) +PCM level (blue lines). Scheme 1. Chemical structure of TM, and the main photoproducts of TM reported by Chayata et al. [12]. There are two other structural isomers of I. The specific isomer depicted in this scheme is named IQ below.](https://figures.academia-assets.com/101494242/figure_001.jpg)


![Hydrogen peroxide was quantified using a protocol adapted from [13] based on the fluorescent dimerization of (p-hydroxypheny1) acetic acid. Briefly, three solutions were prepared. Solution A contained](https://figures.academia-assets.com/101494242/figure_003.jpg)


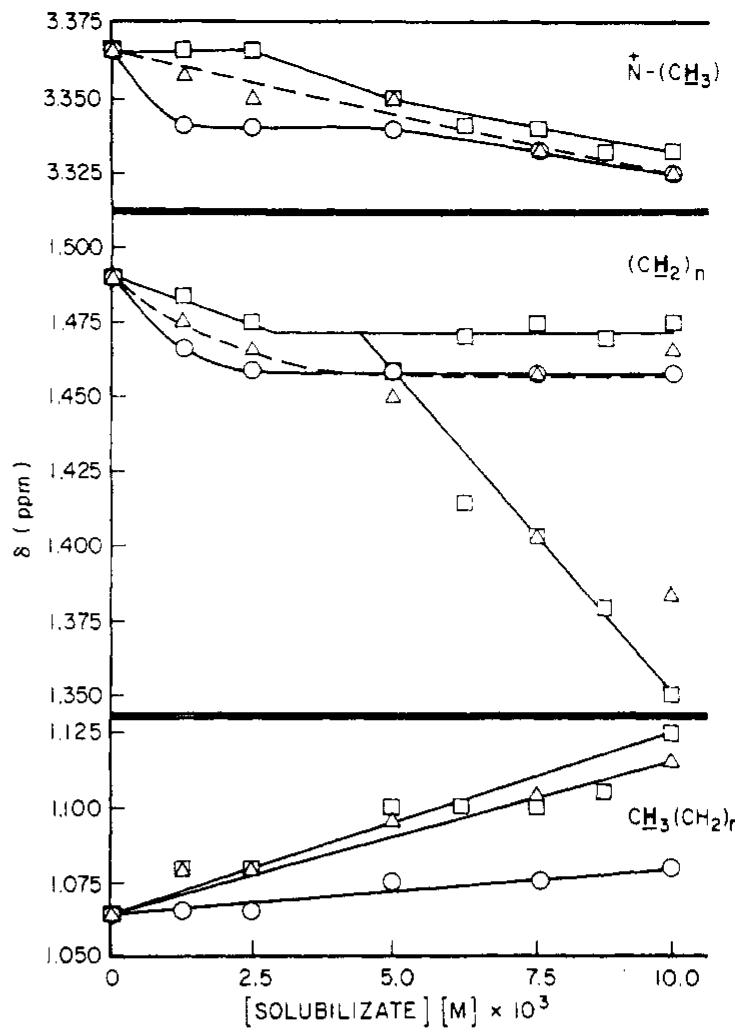
![“In ppm at 60 MHz and at ~35°, relative to external TMS standard; (CTAB] = 0.1 M; [solubilizate] = 0.01 M. ?Aé = differences in chemical shifts of respective protons in CTAB solu- tions with and without solubilizate. * These values refer to differ- ences in the chemical shift of the second split peak to the original position of CH: protons in solubilizate free CTAB solution (see Discussion). Table I. Change in Chemical Shifts (AS) of CTAB Protons for the Addition of Solubilizates in D.O*](https://figures.academia-assets.com/98414245/table_001.jpg)

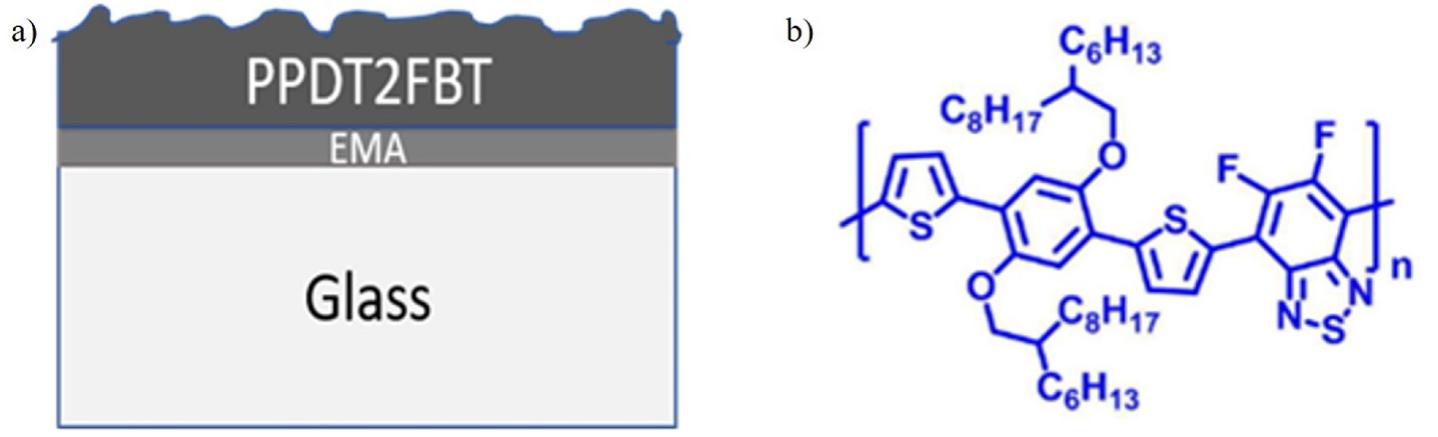
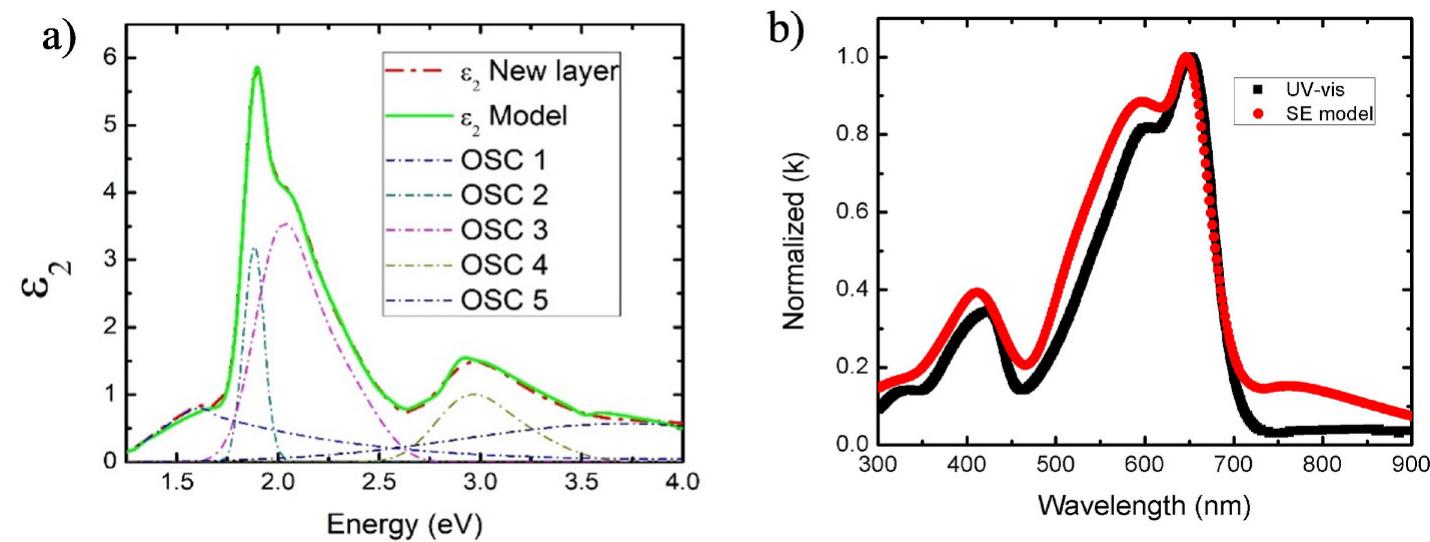
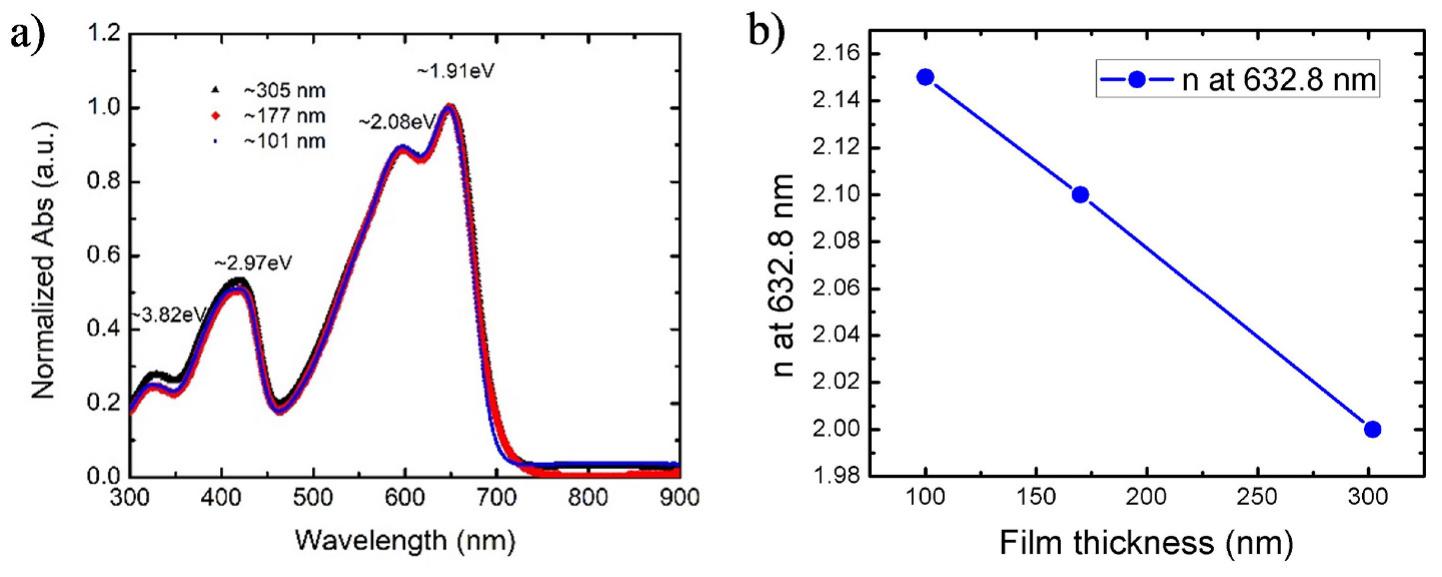
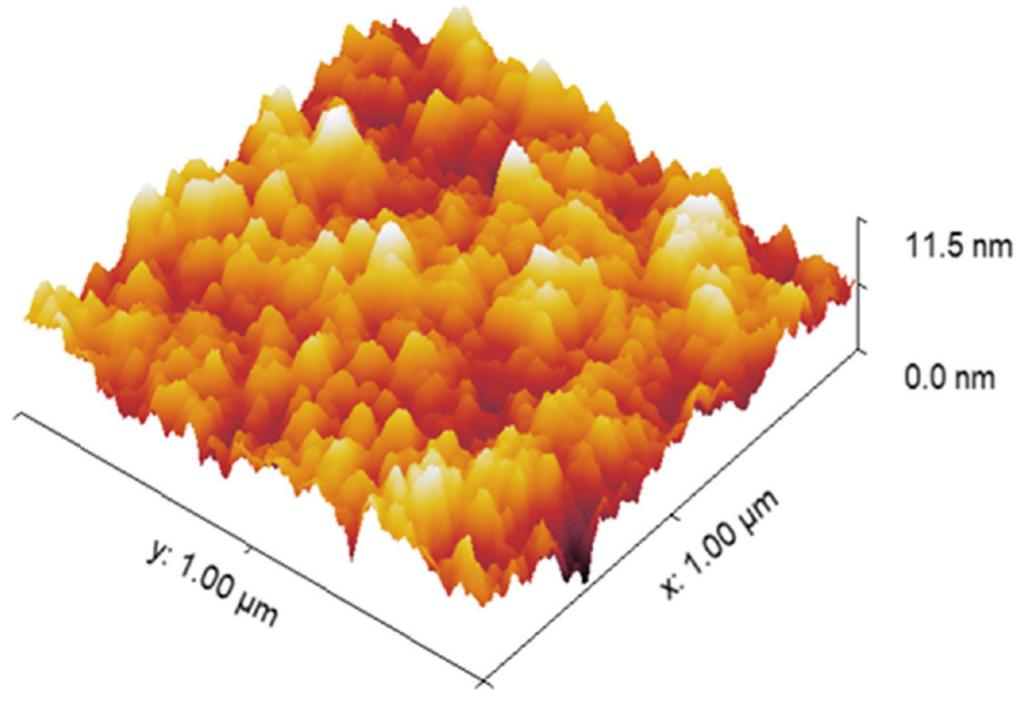
![Fig. 1. a) Schematic diagram of PPDT2FBT thin film on glass substrate; b) chemical structure of PPDT2FBT polymer. The Psi (Y) and Delta (A) obtained from the SE measurement were required to be fitted with a suitable model to identify the optical anc physical properties. We used the CompleteEASE software that come with the J.A. Woollam Co. Spectroscopic Ellipsometer Package t perform the modeling. First, the SE data that consisted of the Y and spectra of the glass substrate were fitted using a Cauchy equation for the wavelength range of 300 nm-900 nm with a known thickness of ~1 mm To fit partially absorptive materials, B-spline is a suitable model in CompleteEASE Package for initial fitting of the SE data. This B-spline model consists of a basis set for polynomial splines and the “B” stands for basis. This model can determine the dielectric function of a material without any assumption of the functional form of light interaction with the thin film. Also, the B-spline parameterized dielectric functions give us the building block of parametrization with the oscillators. A simple recursion formula is used to model the B-splines and a set of Kra- mers—Kronig (KK) consistent basis functions can be obtained from this B- splines [24]. The real dielectric (€|()) spectra of a material can be analytically calculated using the KK causality relationships once the imaginary dielectric (€2(m)) spectra of the material is parameterized by a B-spline curve. For each sample, we used the thickness measured with the profilometer and Root Mean Square (RMS) roughness as fixed pa- rameters as we performed the global fitting of n and k for the ranges of 1-4 and 0 to 2, respectively. For simplicity, we did not turn on the KK fitting parameters at the beginning. The energy resolution of the B-spline model set to 0.05 eV. The B-spline model generated ¢2(w) spectra for the energy range of 1 eV to 4 eV is added in the supplementary document. However, this model resulted in higher MSE. This prompted us to revisit the SE model to minimize the MSE value and, at the same time, deter- mine if the n and k are physically meaningful. To deal with the substrate roughness, we introduced an effective medium approximation (EMA) layer between the PPDT2FBT thin film and the substrate [25]. Brugge- man EMA of 50% host material and 50% void can be used to well define the interfacial layer and that helps to properly model the SE data. Glass slide roughness was measured in the range of 1 nm to 2 nm. Initially, a fixed EMA layer thickness of 1 nm was with 50% composition was selected and allowed to fit the model. Furthermore, the EMA layer thickness was allowed to fit for a range of 1 nm to 2 nm at the next step of fitting the SE model. The use of the EMA layer reduced the MSE, particularly for the spectral range of 300 nm-900 nm. As developed model was applied for measuring the film thickness ranged from ~100 nm to ~305 nm. For this modeling procedure, the films were considered as isotropic and tried to fit within a minimum number of parameters at a](https://figures.academia-assets.com/94814550/figure_001.jpg)
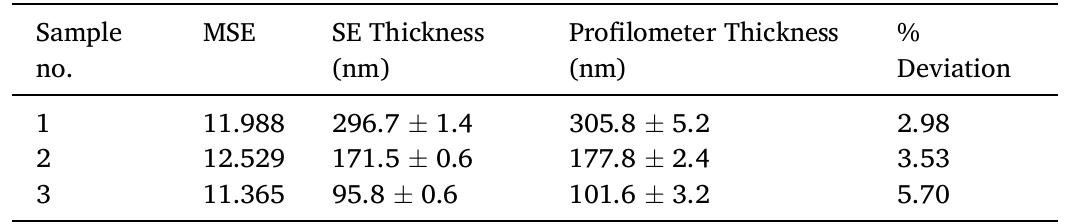
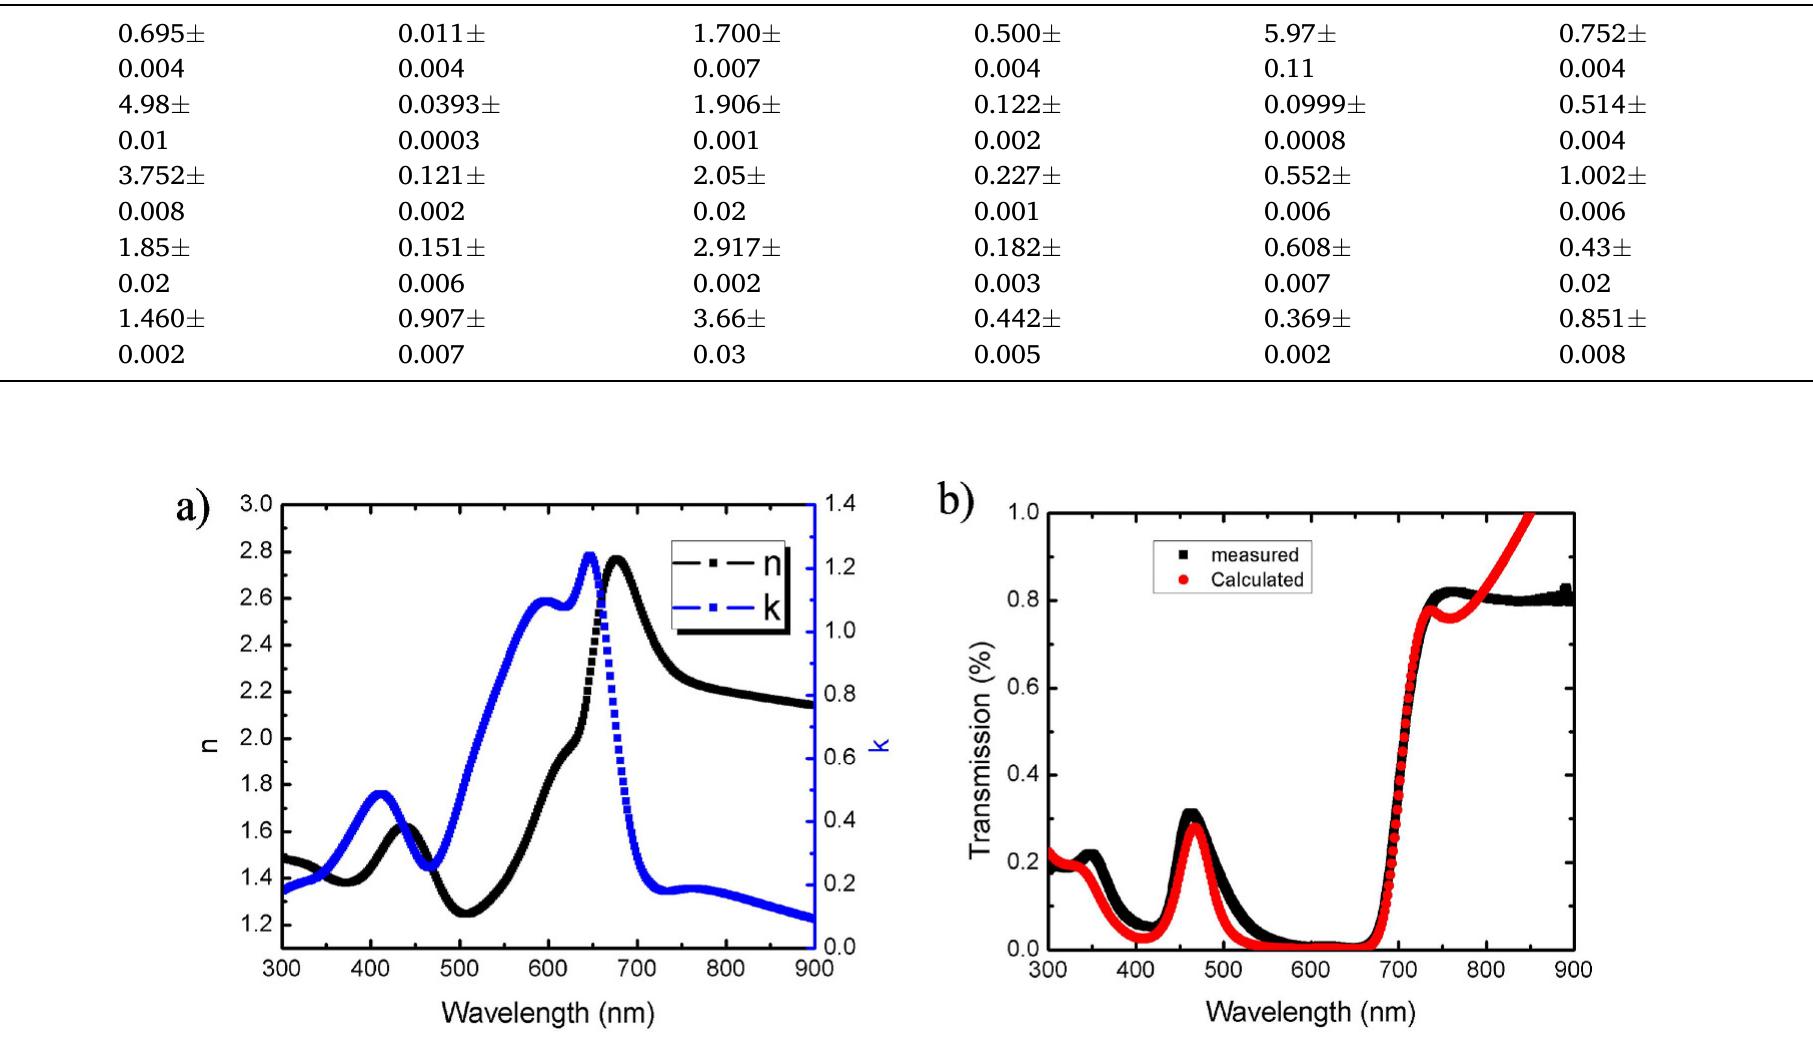
![MSE and thickness obtained from the GEN-OSC model and the thickness measured by profilometer of PPDT2FBT thin film are presented in this table. ~6% of the thicknesses obtained with the surface profilometer. It can be seen clearly from Table 1 that the lower model thicknesses deviated more from the measured values. On the other hand, the MSE values demonstrate the model’s goodness of fit to the experimental data. Generally, the accepted value of MSE is close to one [31]. However, for our samples, the MSE values were between ~11 and ~12. The accept- able thickness deviations obtained and the MSE values indicate the model’s reliability as well as provide the extracted optical properties. We verified the extinction coefficient obtained from the GEN-OSC model by comparing it to the calculated extinction coefficient as it is known that the k has a relationship with the absorption coefficient. We calculated the extinction coefficient using the equation k = «A/4z, where A is the wavelength. We calculated the absorption coefficient («) from the absorption spectra of the UV-Vis data. We plotted the calcu- lated and modeled extinction coefficients for a wavelength range of 300 nm to 900 nm, as shown in Fig. 4(b). These coefficients agree with each other as the peak positions and the absorption edges are at the same positions. Hence, the accuracy of optical properties of PPDT2FBT thin film determined by SE model was verified. We note here, however, that the absorption properties may change depending on the sample-making conditions such as the materials concentration, the curing process, and the spin-coating recipe. Also, the reflectivity and interference effect change with changes in thickness, which results in variations in the extinction coefficient [27].](https://figures.academia-assets.com/94814550/table_001.jpg)


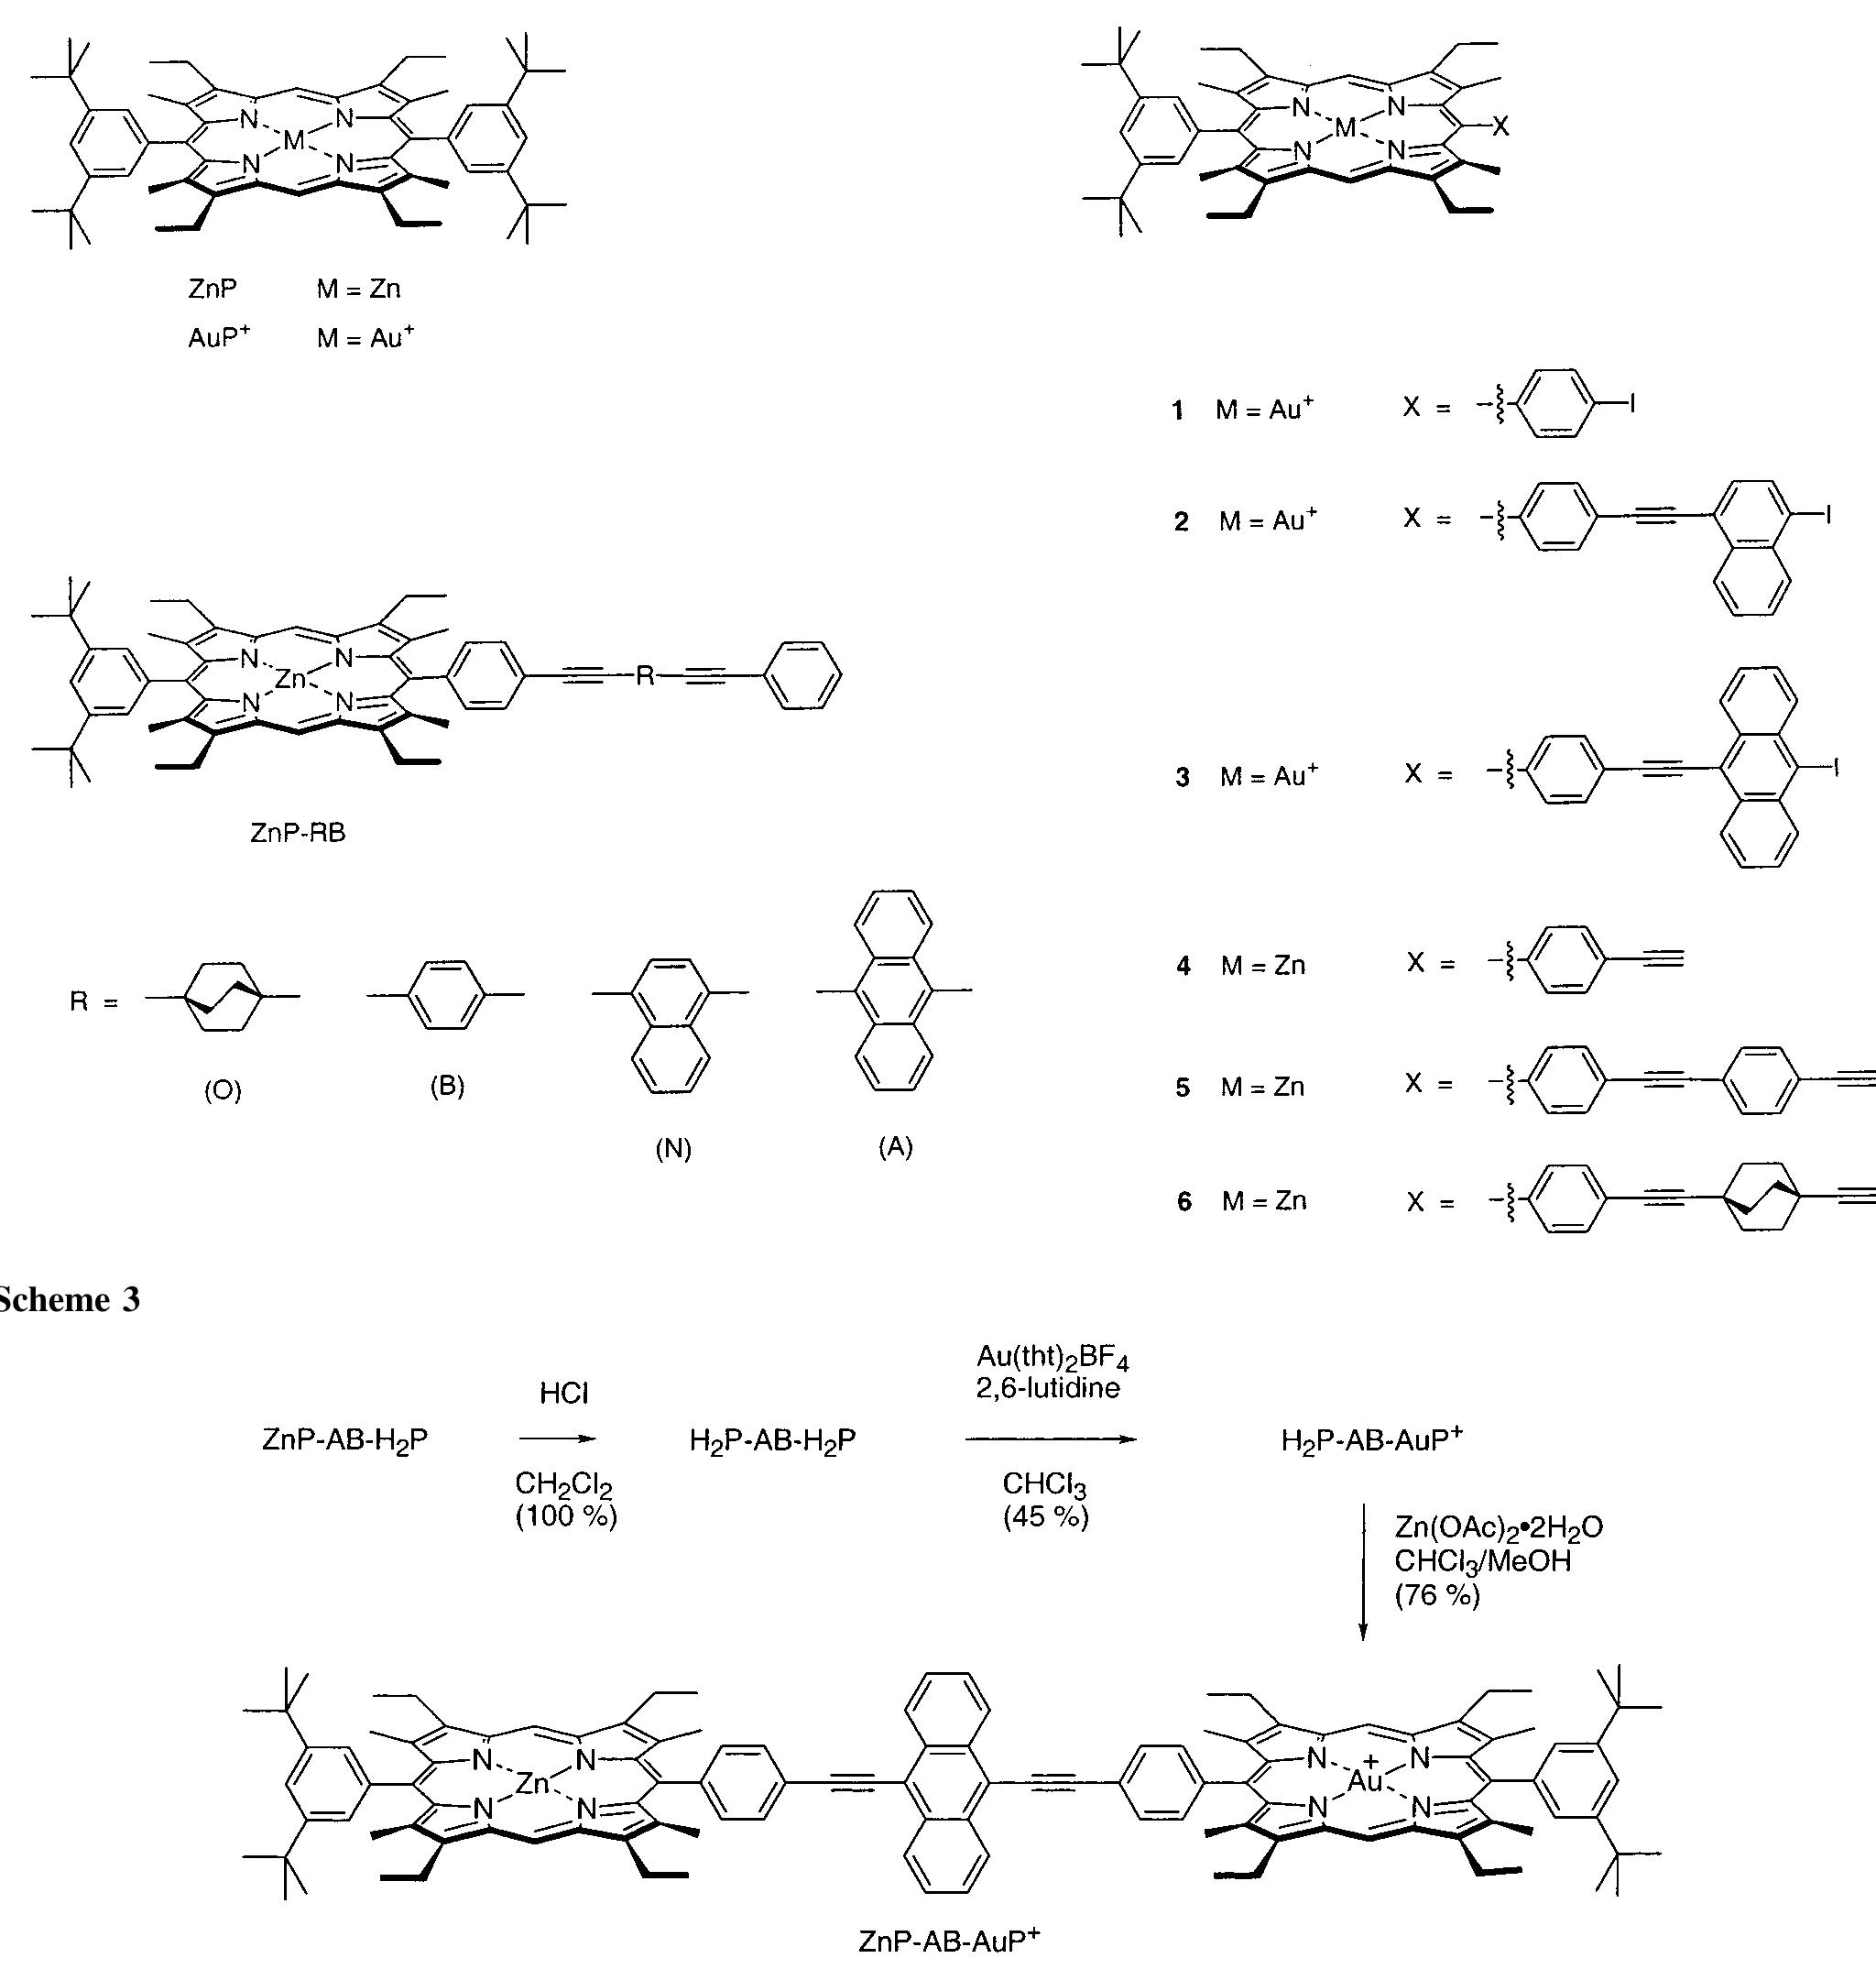
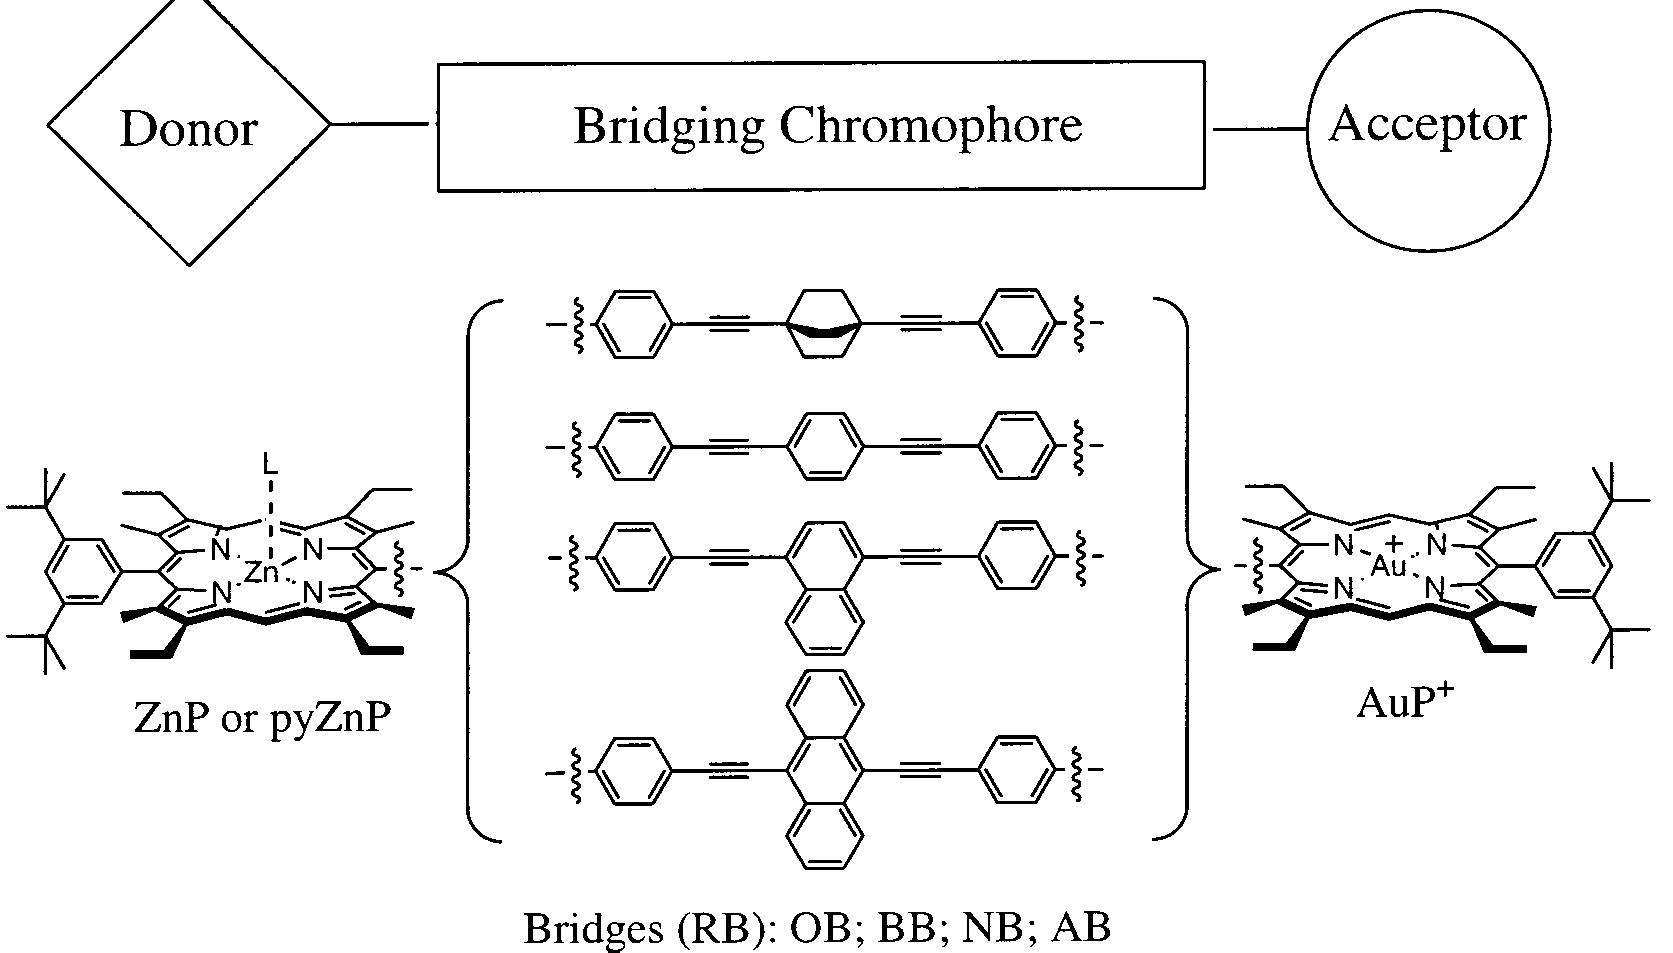
![Figure 1. Structure of the systems studied. The donor is either ZnP (no ligand L) or pyZnP (L = pyridine), and the acceptor is AuPt. The donor—bridge—acceptor (D—B—A) systems are denoted ZnP—RB—AuP* or pyZnP—RB—AuP”, respectively. RB is one of the bridging chromophores: 1,4-bis(phenylethynyl)bicyclo[2.2.2]octane (OB), 1,4-bis(phenylethynyl)benzene (BB), 1,4-bis(phenylethynyl)naphthalene (NB) or 9,10-bis(phenylethynyl)anthracene (AB). The donor reference compounds consist of the porphyrin moiety and the bridging chromophore, D—B.](https://figures.academia-assets.com/94477584/figure_001.jpg)