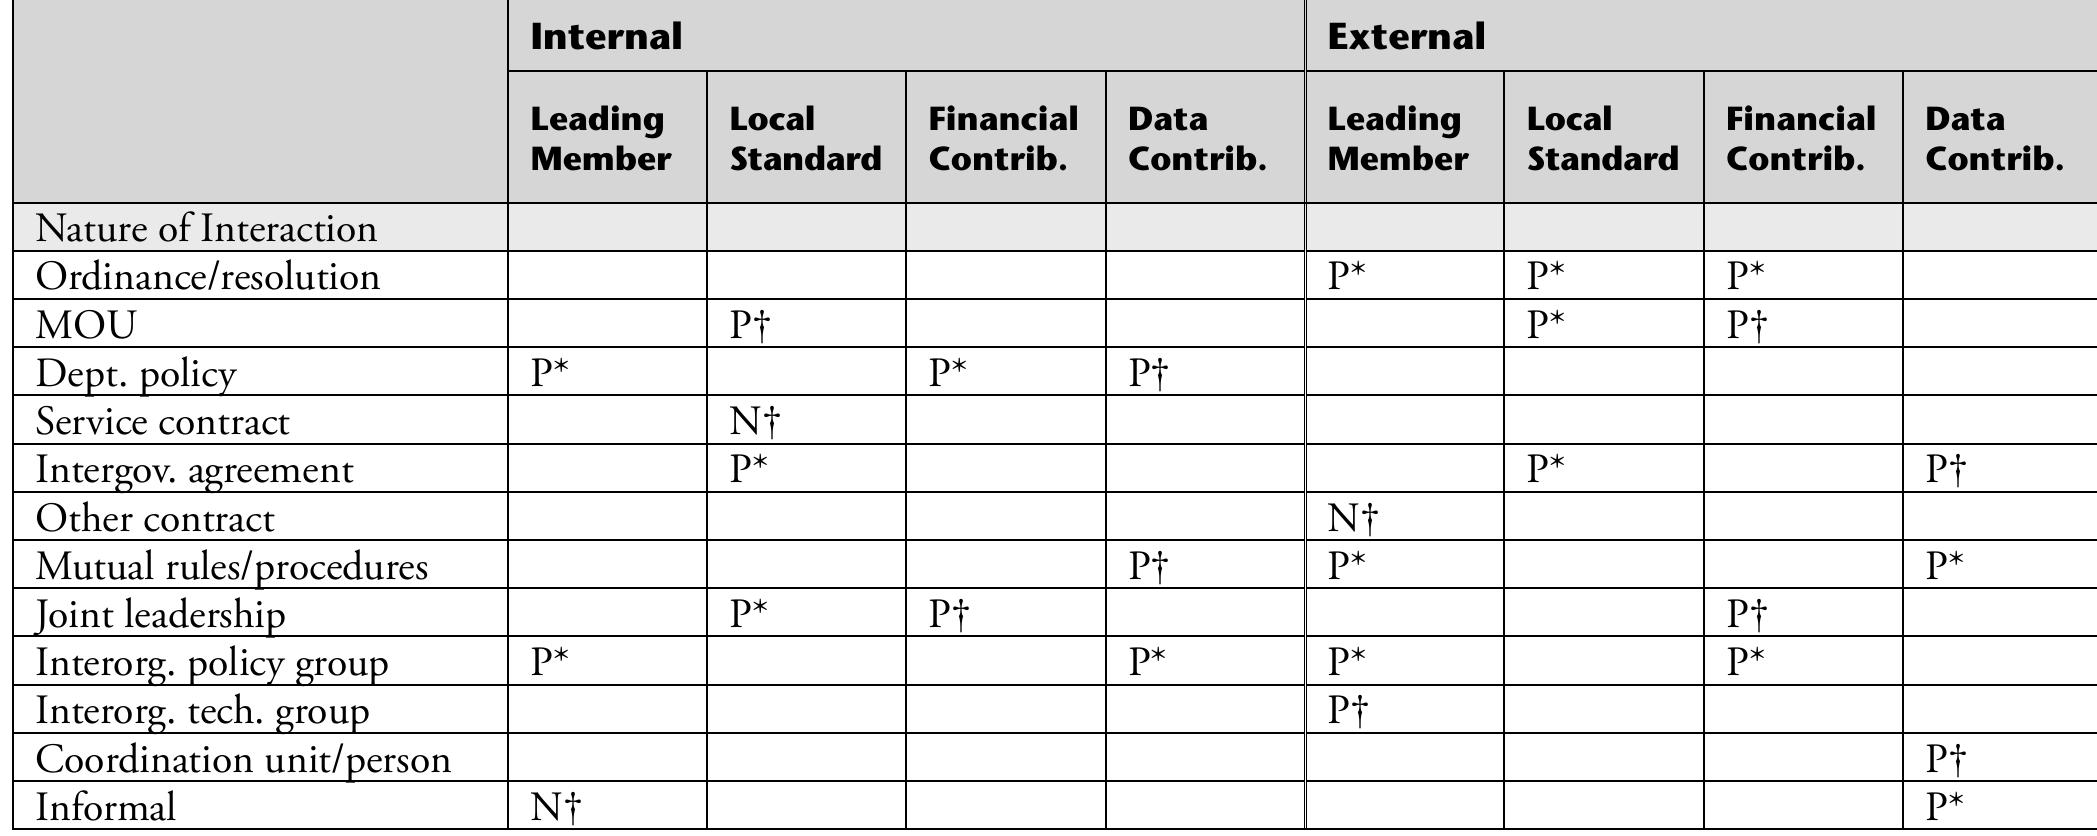
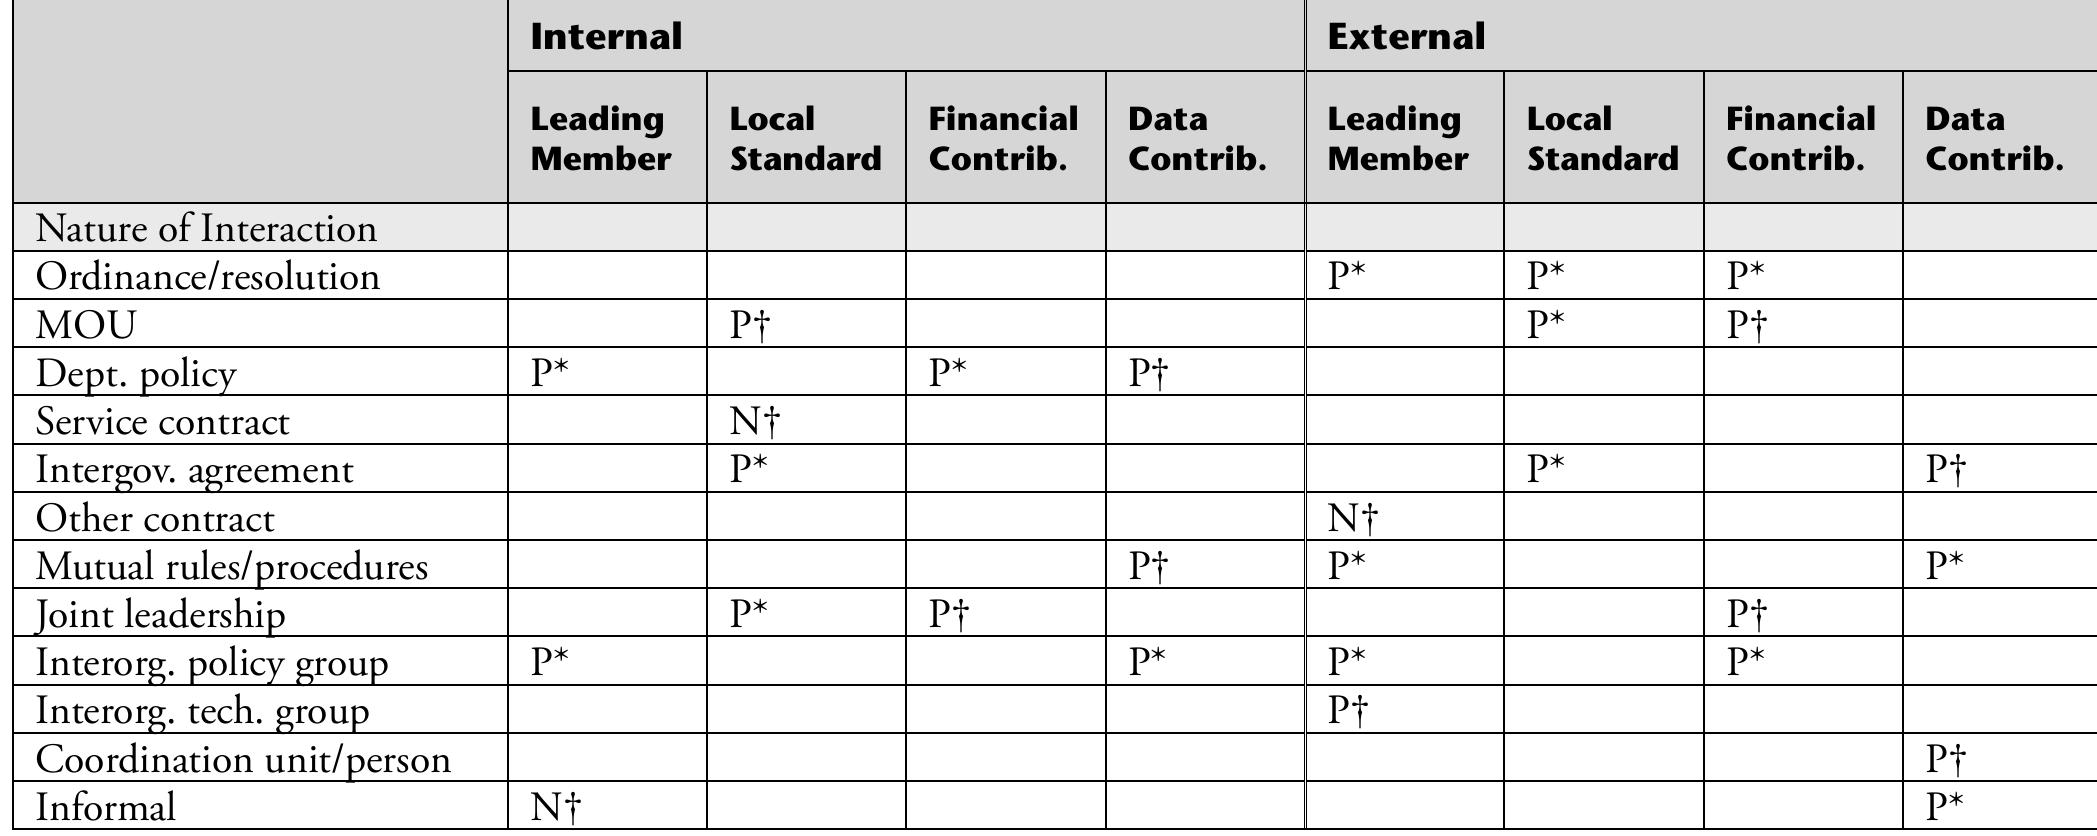
P = Positive association; N = Negative association; *Significant at the 0.05 level; ‘Significant at the 0.1 level Table A4. Relationship between participation (leading member), standardization (local), and financial and data contributions and nature of interaction
subdirectory_arrow_right Figure source:
Related Papers Abstract: In an ongoing pilot project initiated in September of 2001, The Boston Public Health Commission (BPHC), in collaboration with the Department of Urban Studies and Planning at the Massachusetts Institute of Technology (MIT), developed a methodology to superimpose historical and present-day industrial land use datalayers with demographic information and public health data. The goal was to identify and to possibly define a historical relationship between public health concerns of the present time and the past practices of land use within an urban environment. Historic datalayers showing location and type of industries known to emit hazardous substances were interpreted from Sanborn Fire Insurance maps in the years 1888 and 1962. These historic industries, along with current-day industries listed under the Massachusetts Department of Environmental Protection Tier 21 and Major Facility databases, were classified according to the Standard Industrial Classification Manual (SIC) published by the U.S. Department of Commerce, and linked to tables of hazardous chemicals associated with each type of industry. Using ESRI ArcView 3.2 GIS, the historic datalayers were then overlayed with present-day census and public health data. A customized "spatial filtering" function was developed to highlight "hot spot" areas of significant industrial activity and the accumulated risk potential over a period of time: The result is an "archeology" of risk. The intent is to produce a planning tool for strategic environmental health intervention to serve professionals in government and the private sector, such as public health professionals, legislators, city planners and environmental designers.
... Read more
Abstract: Brownfields, land containing both actual and perceived contamination from former uses, pose hurdles to redevelopment, but are worthy of consideration due to their potential for aiding innercity regeneration and providing alternatives to suburban sprawl. Yet the extent of the brownfield land problem is unknown in many cities, and relatively little research has systematically described efficient and effective ways to identify these sites. We demonstrate how a geographic information system (GIS) can be used for the identification and management of a brownfield database. A series of historical fire insurance plans and city directories for successive eras of development are incorporated in the GIS to provide extensive documentation about the location and condition of brownfield land. Such a system offers planners a powerful set of spatial-analytical tools to comprehensively describe the brownfield land situation, as well as being expandable and adaptable to document the general evolution of the urban landscape.
... Read more
Abstract: Science Foundation (DEB 9714833) to be one of the first urban sites in the LTER network. CAP LTER provides a unique addition to LTER research by focusing upon an arid-land ecosystem profoundly influenced and defined by the presence and activities of humans. Our investigation of land use and ecological consequences in an urban environment also involves community partners and K-12 schools. Our aim is to understand the changing urban fabric of our arid urban ecosystem and to offer applications to arid cities across the globe.
... Read more