Clim. Past, 8, 325–335, 2012
www.clim-past.net/8/325/2012/ Climate
doi:10.5194/cp-8-325-2012 of the Past
© Author(s) 2012. CC Attribution 3.0 License.
Extreme climate, not extreme weather: the summer of 1816
in Geneva, Switzerland
R. Auchmann1 , S. Br¨onnimann1 , L. Breda2 , M. Buhler
¨ 1 , R. Spadin2 , and A. Stickler1
1 Oeschger Center and Institute of Geography, University of Bern, Bern, Switzerland
2 Institute for Atmospheric and Climate Science, ETH Z¨urich, Z¨urich, Switzerland
Correspondence to: R. Auchmann (
[email protected])
Received: 3 October 2011 – Published in Clim. Past Discuss.: 8 November 2011
Revised: 18 January 2012 – Accepted: 20 January 2012 – Published: 24 February 2012
Abstract. We analyze weather and climate during the 1 Introduction
“Year without Summer” 1816 using sub-daily data from
Geneva, Switzerland, representing one of the climatically One of the most severe climatic deviations of the past few
most severely affected regions. The record includes twice hundred years in central Europe was the “Year Without Sum-
daily measurements and observations of air temperature, mer” (YWS) 1816 (Stothers, 1984; Briffa and Jones, 1992;
pressure, cloud cover, wind speed, and wind direction as well Harington, 1992; Robock, 1994, 2000). This event has been
as daily measurements of precipitation. Comparing 1816 to a studied extensively both by historians (Skeen, 1981; Pfis-
contemporary reference period (1799–1821) reveals that the ter, 1992, 1999) and climate scientists (Briffa and Jones,
coldness of the summer of 1816 was most prominent in the 1992; Kington, 1992; Shindell et al., 2004) with respect to
afternoon, with a shift of the entire distribution function of causes and consequences. The event is mostly related to
temperature anomalies by 3–4 ◦ C. Early morning tempera- the 1815 eruption of Tambora in Indonesia, which injected
ture anomalies show a smaller change for the mean, a sig- a huge amount of sulfur into the stratosphere that was capa-
nificant decrease in the variability, and no changes in nega- ble of altering global climate (Stommel and Stommel, 1983;
tive extremes. Analyzing cloudy and cloud-free conditions Stothers, 1984, 1999; Piervitali et al., 1997; Briffa et al.,
separately suggests that an increase in the number of cloudy 1998; Chenoweth, 2001; Stendel et al., 2005). In addition,
days was to a significant extent responsible for these features. reduced solar activity related to the so-called Dalton mini-
A daily weather type classification based on pressure, pres- mum might have played a role (Lean et al., 1995; Mann et
sure tendency, and wind direction shows extremely anoma- al., 1998).
lous frequencies in summer 1816, with only one day (com-
The global scale cooling due to the Tambora eruption is es-
pared to 20 in an average summer) classified as high-pressure
timated to approximately 0.5 ◦ C. However, in Central Europe
situation but a tripling of low-pressure situations. The after-
where consequences were devastating both economically and
noon temperature anomalies expected from only a change in
socially (Hoyt, 1958; Stothers, 1999; Oppenheimer, 2003),
weather types was much stronger negative in summer 1816
the cold anomalies were much larger (Trigo et al., 2009;
than in any other year. For precipitation, our analysis shows
Luterbacher et al., 2004), calling for additional or amplify-
that the 80 % increase in summer precipitation compared to
ing mechanisms.
the reference period can be explained by 80 % increase in the
frequency of precipitation, while no change could be found Most previous studies on the YWS in Europe addressed
neither in the average intensity of precipitation nor in the the monthly or seasonal scale (e.g. Self et al., 1980; Trigo
frequency distribution of extreme precipitation. In all, the et al., 2009), for which abundant information is available
analysis shows that the regional circulation and local cloud from direct measurements as well as climate proxies and
cover played a dominant role. It also shows that the sum- documentary data. Daily or even sub-daily data have much
mer of 1816 was an example of extreme climate, not extreme more rarely been studied (Baron, 1992; Chenoweth, 2009).
weather. This would be important, however, as sub-daily information
might potentially give further insights into the underlying
Published by Copernicus Publications on behalf of the European Geosciences Union.
326 R. Auchmann et al.: Extreme climate, not extreme weather: the summer of 1816 in Geneva, Switzerland
e au
l at
P
ns
ss
ai
i
nt
w
S
ou
M
ra
Ju
Geneva ve s
lè
a lp
A
.S
Mt
0
N 100 km
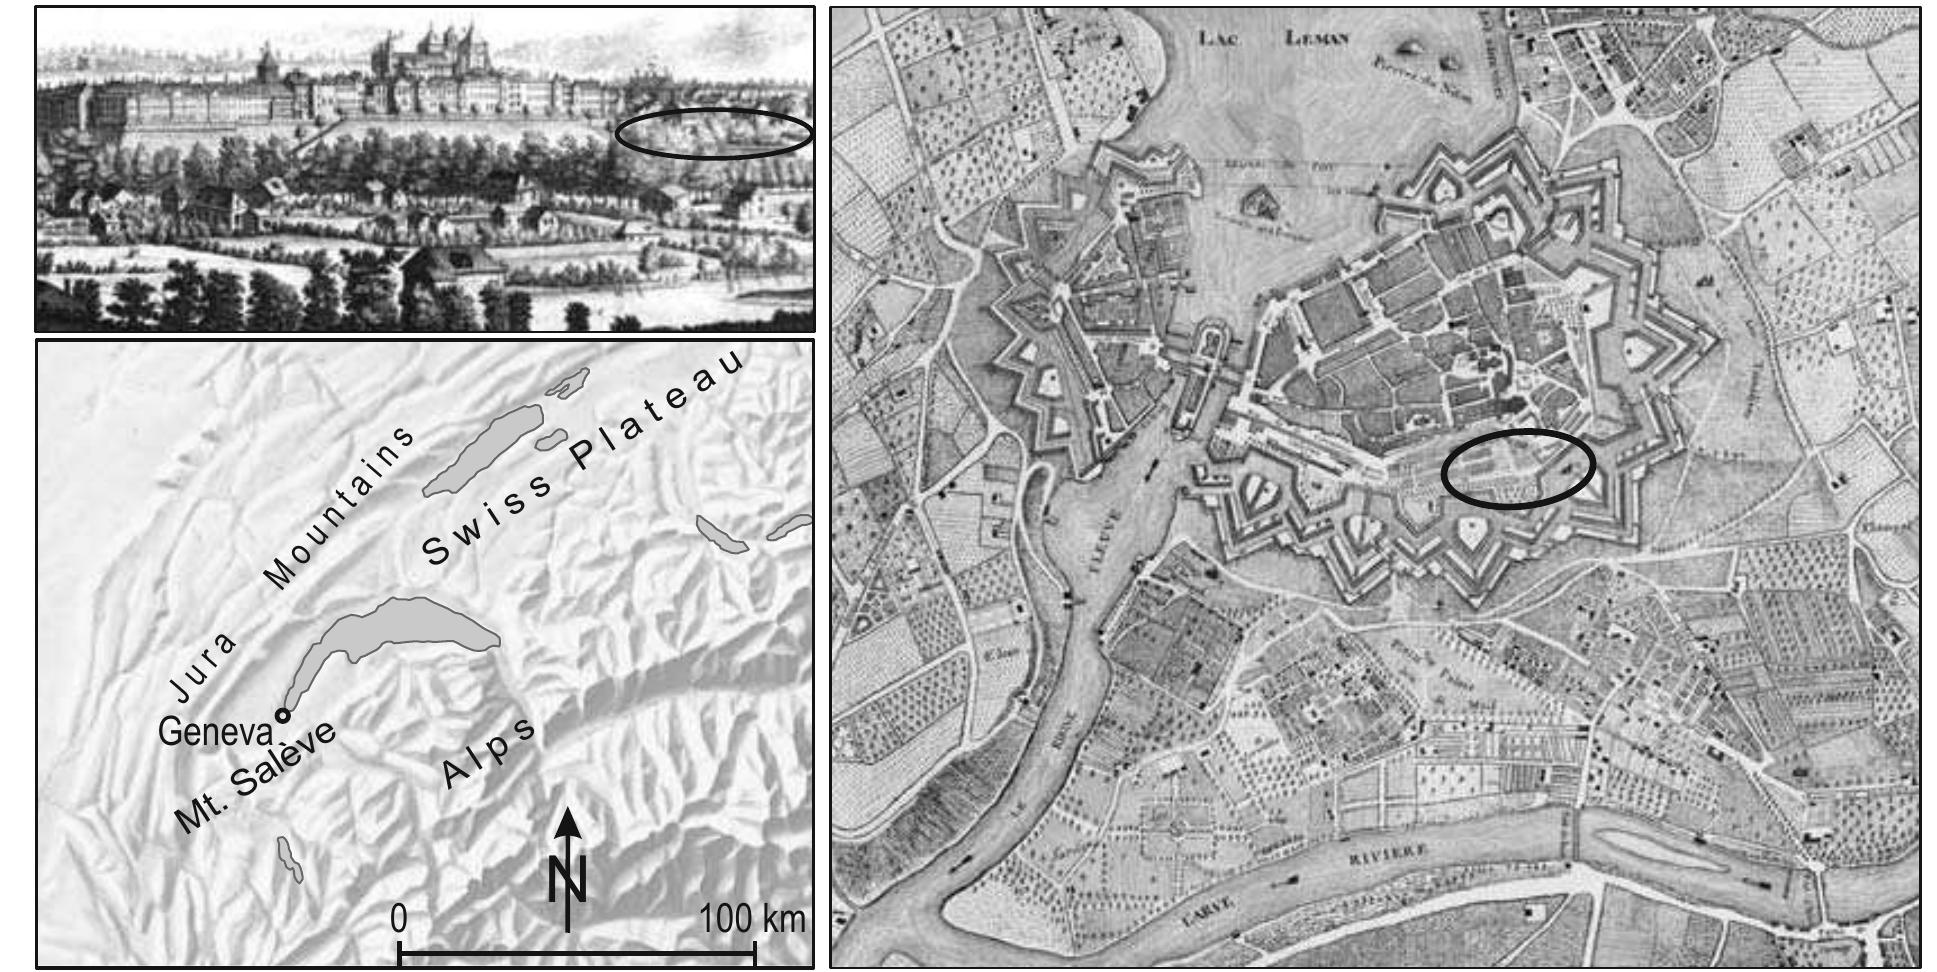
Fig. 1. Approximate location of the weather station of Geneva in 1799–1821 in a contemporary view (top left panel) and map (right panel)
of the city. The bottom left panel shows the topography of the region (relief: Eidgen¨ossische Erziehungsdirektorenkonferenz).
processes. For the assessment of changes in climate variabil- The paper is organized as follows. In Sect. 2, data (includ-
ity and extremes, daily to sub-daily data resolution is indis- ing all aspects of homogeneity) and methods are explained.
pensable (Brandsma and K¨onnen, 2006; Alexander, 2006). In Sect. 3 we present and discuss the results. Conclusions are
In our study, temporal attribution of the summer 1816 cool- drawn in Sect. 4.
ing (e.g. morning or afternoon cooling) as well as the analysis
of a combination of parameters (e.g. cloud cover and temper-
ature) cannot be conducted by using mean data. In contrast 2 Data and methods
to measured values (i.e. the sub-daily data used in this study),
they do not represent a state of the atmosphere. Both meth- 2.1 Meteorological measurements and observations
ods may contribute to a better understanding of the structure from Geneva
of the cooling and provide some new details into processes
and mechanisms involved. One main restriction so far was The data from Geneva were digitized from printed sources
data availability as many data series were simply not avail- (Journal de Gen`eve, Biblioth`eque britannique/universelle)
able in their original form. reaching back to the 1780s. We digitized all elements (tem-
In this paper we analyze the YWS 1816 in a recently perature, precipitation, pressure, clouds, wind) at the full
digitized record of twice daily measurements performed in temporal resolution and converted the data to current units.
Geneva, Switzerland, including air temperature, pressure, No further pressure reduction was necessary as it was already
cloud cover, wind speed and direction, and daily precipita- reduced to constant 10◦ R. This is different to today’s stan-
tion. Geneva is in the region with the largest negative tem- dard (0 ◦ C). However, this is irrelevant for our study as we
perature anomaly (e.g. Pfister, 1992; Trigo et al., 2009) in only use standardized pressure anomalies and pressure ten-
summer 1816. The aim of the paper is to analyze to what dency. We focus on the sub-period 1799–1821, which can
extent the year without summer was characterized by ex- be considered internally homogeneous at least with respect
treme climate or by extreme weather (i.e. whether changes to temperature (the homogenization of the full record is on-
are largest in the central part of the frequency distribution or going). There were no reported changes in station operation
near the extremes). Furthermore, by analyzing sub-daily data during that time. Measurements were made in the old botani-
we hope to get more insights into the mechanisms responsi- cal garden, situated on the Bastion St-L´eger in the southwest
ble for the YWS. Finally, the paper aims at identifying new of Geneva (Fig. 1). The old botanical garden had an effec-
characteristics of the YWS that are testable in or comparable tive area of 1800 m2 (Sigrist and Bungener, 2008) and hence
to a modeling framework. the influence of surrounding buildings can be assumed small
(Pictet, 1822). Before 1799 observations were made in Gen-
thod, after 1822 (until 1825) the observation site was situated
Clim. Past, 8, 325–335, 2012 www.clim-past.net/8/325/2012/
R. Auchmann et al.: Extreme climate, not extreme weather: the summer of 1816 in Geneva, Switzerland 327
at the southeastern edge of the town. In 1826 it was relocated and the years 1809 to 1811 (unknown eruption in 1809, Cole-
to the new botanical garden, on the northern shore of Lake Dai et al., 2009). The remaining 16 years were used as a ref-
Geneva (Schuepp, 1961). erence against which we could compare the YWS 1816. The
During the period 1799–1821, Marc-Auguste Pictet was focus in this paper is on the summer of 1816, although we
responsible for collecting and publishing the observational also analyzed the summer of 1815 and the winters of 1815/16
data. There are twice daily measurements of air tempera- and 1816/17 (L. Breda, unpublished master thesis).
ture and pressure and twice daily observations of cloud cover, First, temperature values were analyzed and compared to
wind direction and (sometimes) speed. One observation was the reference because analyzing the occurrences of frost or
performed at sunrise (most likely local astronomical sunrise) other environmentally relevant indicators requires an abso-
with the aim of capturing the minimum temperature and one lute scale rather than anomalies. In a second step, a mean
at 14:00 LT, which is close to the maximum. Because anoma- annual cycle for temperature was formed from the refer-
lies from the seasonal cycle are computed later on, the ef- ence period by fitting a seasonal cycle consisting of the first
fects of systematic errors related to the time of observation two harmonics. We then subtracted this annual cycle from
are small. In addition to the twice daily reports, daily pre- both the reference period and the YWS period in order to
cipitation measurements are also reported. Of course, twice study anomalies. Precipitation was analyzed in the form of
daily observations cannot capture a complete diurnal cycle, absolute values (not anomalies) because of its skewed and
in contrast to, e.g. hourly observations. According to our in- bounded distribution function and because the seasonal cy-
formation, there were no changes in instruments, reporting, cle is not well defined. In addition, statistics of precipita-
and location during the period 1799–1821. However, notes tion frequency (number of days with >0.1 mm) and 24-h pre-
in the station history revealed a trend inhomogeneity in this cipitation intensity (i.e. the amount of precipitation on days
period which was corrected. Available calibration informa- with precipitation >0.1 mm) were analyzed. For tempera-
tion indicated a drift in temperature, which is a known error ture anomalies and 24-h precipitation intensity, we estimated
that is caused by the chemical composition of the glass and probability density functions in order to address the frequen-
has been studied in detail for the case of Hohenpeißenberg cies of weather extremes. Also, we assessed the dependence
in Germany (see Winkler, 2009, and references therein). As of temperature anomalies upon cloud cover. Note that due
the instrument in Geneva was of the same type as that used at to homogeneity reasons (see Sect. 2), all analyses involving
Hohenpeißenberg and because the reported shift in the cali- cloud cover used a reduced base period 1812–1821 (without
bration (0.6 ◦ C) also was very similar, we corrected it in the the volcanically perturbed years 1815–1817).
same way as Winkler (2009) by decreasing temperature by Finally, in order to further analyze the mechanisms, we
0.1 ◦ C per year (from 1796–1801). From 1802 onwards we performed a simple weather type classification for sum-
subtracted 0.6 ◦ C. The instrument type used was a mercury mer based on wind direction, pressure, and pressure ten-
thermometer with an isolated bulb, divided in 80 parts in unit dency in order to address the effects of changing frequen-
degree R´eaumur (Pictet, 1822). cies of weather types and changes within weather types. The
Cloud cover observations were recorded qualitatively and weather types were defined based on all summers in the ref-
noted verbally in a semi-standardized terminology. In a step- erence period. Then the same criteria were applied to the
wise procedure, we categorized the cloud observations into summer of 1816. By retaining only the weather type infor-
six cloudiness groups, from clear sky to fully covered. For mation for 1816, randomly sampling from the corresponding
our analysis, we isolated days on which both the morning and weather types during the reference period, and then compar-
noon observations could clearly be identified as either cloud ing back with the observed anomaly, we estimate the contri-
free or fully covered, respectively. By analyzing the distribu- bution of changes in weather types to the anomalies in tem-
tion of the cloudiness classes over time, we clearly found the perature, precipitation, or cloud cover. A Monte Carlo ap-
cloud cover series to be inhomogeneous. Unreasonable cloud proach (n = 10 000) was applied to obtain a measure of vari-
cover distributions and year-to-year variations appeared in ability associated with the sampling, assuming temporal in-
the entire period 1799–1811 (which is partly also reflected dependence of the weather types from one day to the next.
in the terminology used). However, the period 1812–1821 Although this assumption is certainly not valid, the effect
was found to be more homogeneous and relatively reliable. on the result is considered small as other sampling strate-
Therefore, any further analysis involving cloud cover used gies (e.g. distinguishing 1st and 2nd days in a sequence or
only this (shorter) period. sampling 2-day periods) gave similar results.
2.2 Analysis methods
The period 1799–1821 was chosen as a base period. From
this period we removed the volcanically perturbed years,
namely the years 1815 to 1817 (which are perturbed by the
eruption of Tambora in April 1815, Bradley and Jones, 1995)
www.clim-past.net/8/325/2012/ Clim. Past, 8, 325–335, 2012
328 R. Auchmann et al.: Extreme climate, not extreme weather: the summer of 1816 in Geneva, Switzerland
40
Reference
20
1816
30
Frequency (%)
Temperature (°C)
10
20
0
10
1816
Reference mean
-10 Reference std.dev. 0
Reference min and max -10 -5 0 5 10 -10 -5 0 5 10
Class boundaries (°C) Class boundaries (°C)
30
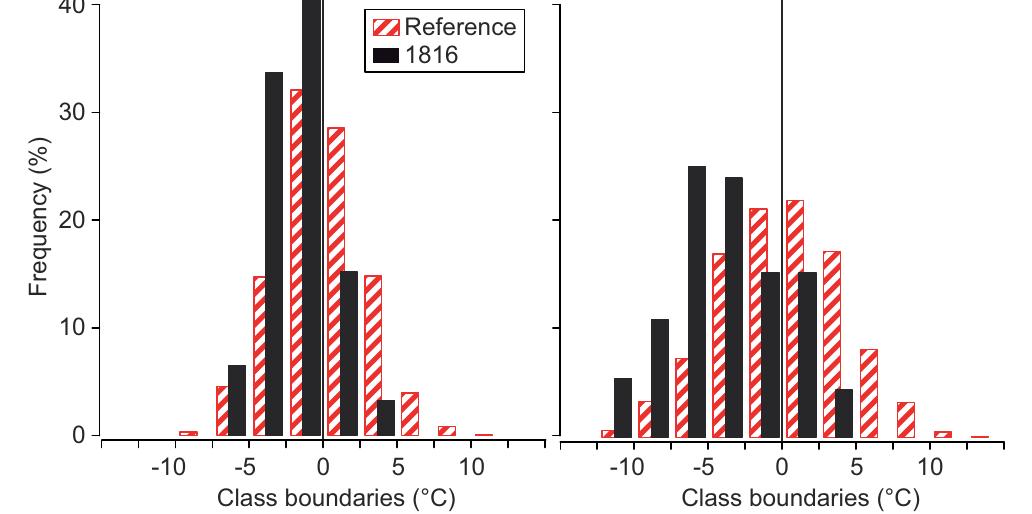
Fig. 3. Histograms showing the frequencies of occurrence
(in percent) of temperature anomalies at sunrise (left panel) or
20 14:00 LT (right panel) in the summer months (June to August) of
Temperature (°C)
1816 (black) and in the reference period (red patterned).
10
Both the early morning temperatures and afternoon tem-
0 peratures were clearly and consistently below the reference
mean in summer 1816. However, the afternoon temperatures
-10
were more anomalous than the early morning temperatures.
Jan Feb Mar Apr May Jun Jul Aug Sep Oct Nov Dec This appears more clearly in Fig. 3, which shows histograms
Fig. 2. Time series of daily values of temperature at sunrise (top
of the anomalies with respect to the reference period for the
panel) and 14:00 LT (bottom panel) in the year 1816 (thin black reference period (red) and the YWS (black) for the sunrise
solid line) as well as for the average of the reference period (red observation (left panel) and the 14:00 LT observation (right
dashed line). The blue (solid bold) lines denote ±1 standard devia- panel) for the summer period (June–August). The sunrise
tion from the mean; the green (dashed bold) lines give the minima temperature was, on average, about 1.8 ◦ C cooler than the
and maxima for the reference period. Note that all annual cycles reference. Interestingly, the distribution is quite different.
from the reference period were obtained from the statistics for each Contrary to what one might expect, negative extremes were
calendar day. They were then smoothed by fitting the first two har- not more frequent in 1816 than in the reference, but positive
monics of the annual cycle. The black dotted vertical line in the up- extremes were much less frequent in 1816. The distribution
per panel indicates the last day of morning temperatures in spring is significantly narrower for 1816 than for the reference pe-
below 0 ◦ C in 1816. Ticks on the x-axis indicate the mean last day-
riod. In the early afternoon, the difference in the mean was
of-year with morning temperatures below 0 ◦ C in the reference pe-
riod (red dashed tick), ±1 standard deviation (blue solid bold ticks),
much larger and amounts to about 3.8 ◦ C cooling for 1816
and the earliest and latest date with negative spring temperatures in relative to the reference period. In this case, the entire dis-
the morning (green dashed bold ticks). The black dotted vertical tribution is shifted: cold extremes were more frequent, warm
line in the lower panel indicates the date of the annual maximum extremes less frequent. From this analysis we conclude that
temperature in 1816. the YWS was mainly an afternoon phenomenon.
3.2 Frequency of cloud-free days and temperature
3 Results and discussion anomalies
3.1 Morning and afternoon temperature and frequency Clouds might explain the different effect found in the sun-
distributions rise and the 14:00 LT temperature. Cloud cover is expected
to lead to an increase of the downwelling longwave radi-
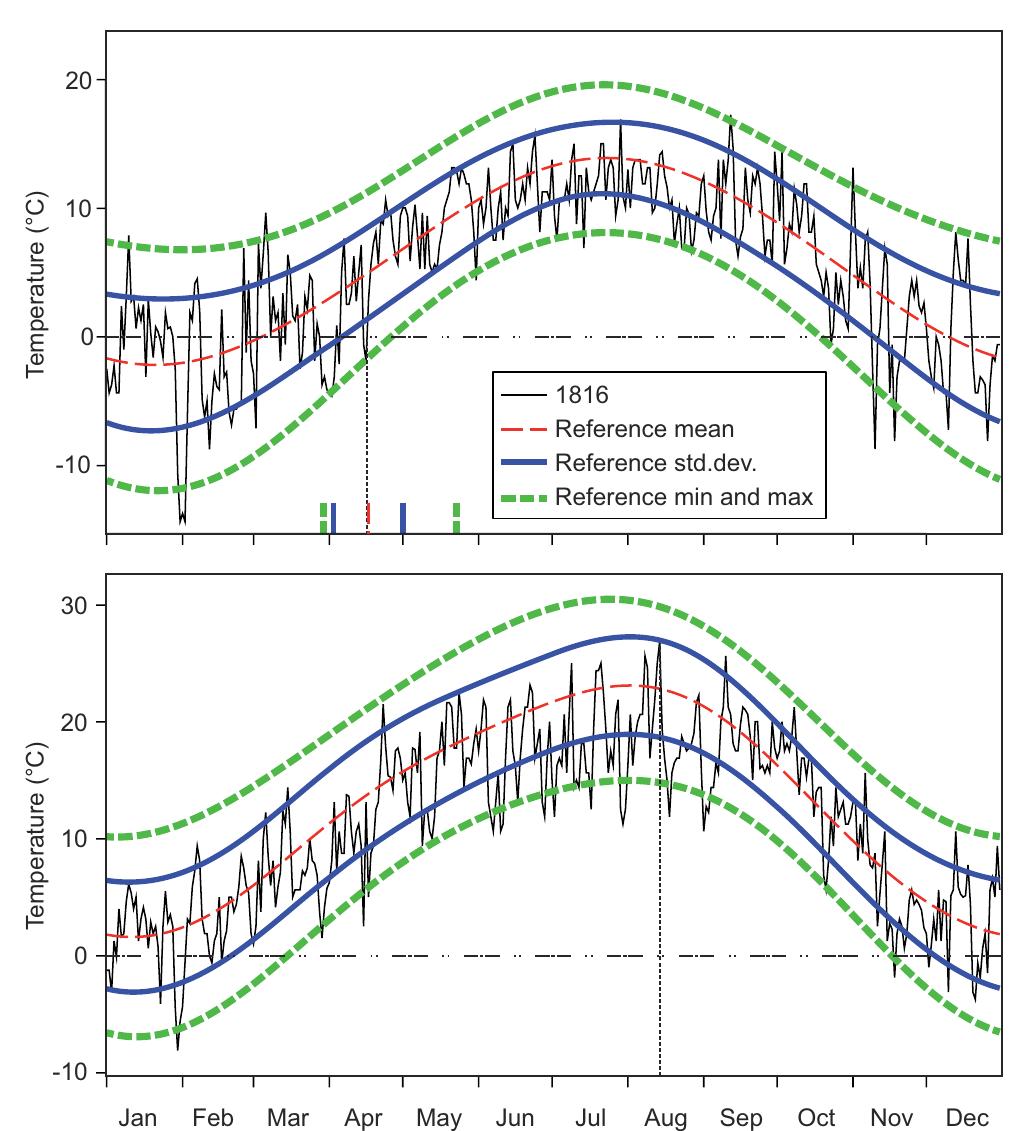
Daily temperatures of the years 1816 are shown in Fig. 2 ation during the nights and to a decrease of the incoming
together with the mean annual cycle from the reference pe- shortwave radiation during the day. If nothing else changes,
riod as well as the corresponding annual cycle of minima and cloud cover would thus lead to warmer conditions at sun-
maxima. The last negative spring temperature in 1816 was rise and colder conditions at 14:00 LT. This is observed in
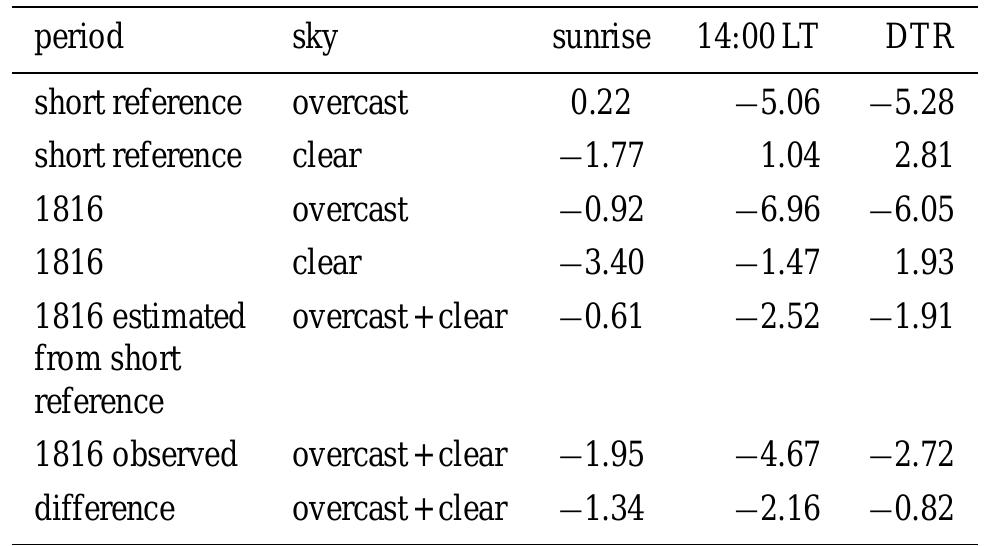
observed at sunrise on 16 April. This corresponds almost ex- the (short) reference period (Table 1), where overcast nights
actly to the mean date of the last negative spring temperature were about 2 ◦ C warmer than clear nights, and 14:00 LT tem-
in the reference period. The annual maximum temperature in perature were about 6 ◦ C cooler, leading to a 8 ◦ C change in
1816 was 26.9 ◦ C (observed on the afternoon of 14 August). the difference between 4:00 LT and sunrise (which for sim-
Although this is a low value for an annual maximum, one plicity we address as diurnal temperature range or DTR).
even lower value was observed in the reference period.
Clim. Past, 8, 325–335, 2012 www.clim-past.net/8/325/2012/
R. Auchmann et al.: Extreme climate, not extreme weather: the summer of 1816 in Geneva, Switzerland 329
400
Table 1. Effect of clouds on temperature. Averaged summer-
time (June–August) temperature anomalies (◦ C) at sunrise and at
40 75
14:00 LT as well as their difference (diurnal temperature range, 30
DTR) for days with clear sky (both sunrise and 14:00 LT) or fully 300
precipitation amount (mm)
overcast days (both sunrise and 14:00 LT) during a short reference
number of precipitation days
30
period (1812–1814 and 1818–1821, i.e. the period with relatively
number of days in 1816
50
reliable cloud observations) and in summer 1816. Row 5 shows the
frequency (%)
20
200
average temperature anomaly for the sum of overcast and clear days 20
for 1816 assuming the mean values from the short reference in the
first two rows and the number of fully overcast days (21) and fully 25
10
clear days (15) from 1816. Row 6 is the same but using the mean 10
100
values from the year 1816 itself. The lowest row shows the differ-
ence between the two. All temperature anomalies are with respect
to the long reference period. 0 0 0 0
1800 1810 1820 0 10 20 30 40 50
Class boundaries (mm/d)
period sky sunrise 14:00 LT DTR
short reference overcast 0.22 −5.06 −5.28 Fig. 4. Left panel: precipitation sums (green line, right scale) and
number of rainy days (bars, left scale) in summer (June to August)
short reference clear −1.77 1.04 2.81
from 1799–1821. The years that were excluded from the reference
1816 overcast −0.92 −6.96 −6.05 period are shown in light blue, 1816 in black. Right panel: his-
1816 clear −3.40 −1.47 1.93 togram showing the frequency of occurrence (left scale: percent,
1816 estimated overcast + clear −0.61 −2.52 −1.91 right scale: number of days for 1816) of precipitation amounts in
from short the summer months (June to August) of 1816 (black) and in the
reference reference period (blue patterned). Note that precipitation amounts
1816 observed overcast + clear −1.95 −4.67 −2.72 <0.1 mm were excluded.
difference overcast + clear −1.34 −2.16 −0.82
only addresses cloud-free and overcast conditions and that
the reference period is shorter.
In fact, the summer of 1816 was anomalously cloudy. 3.3 Precipitation sum, frequency and intensity
Not a single cloud-free day was observed in June 1816 and
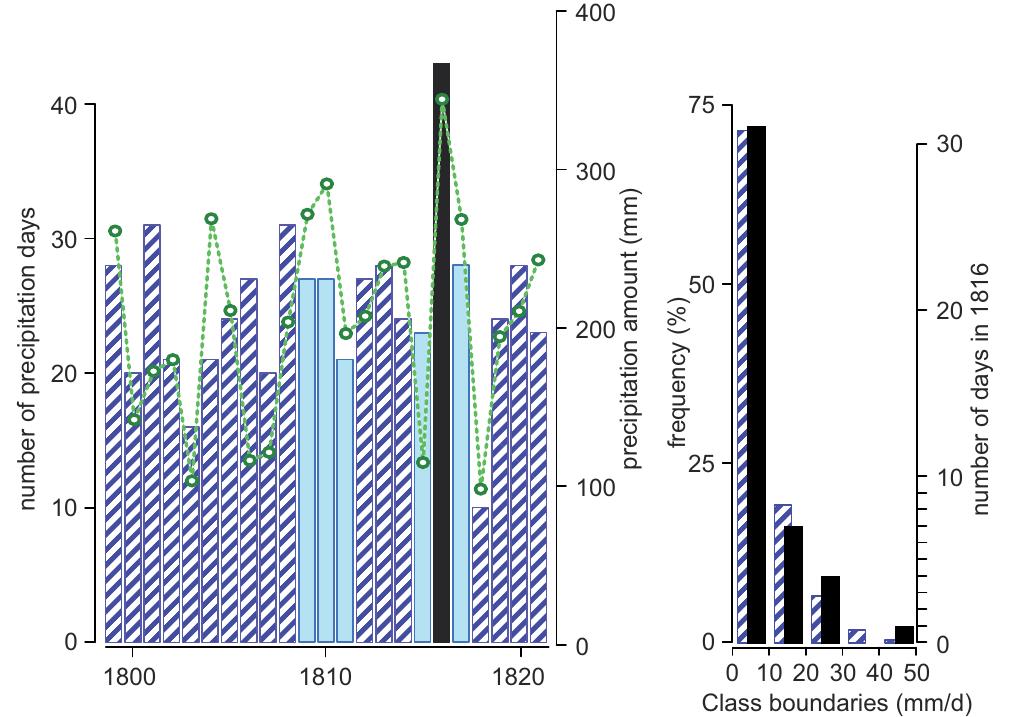
only 15 in the whole summer. This is much less than in the The total amount of rainfall was as much as 80 % higher in
(short) reference period 1812–1821 (22 days). Conversely, summer 1816 compared to the reference period. Partitioning
the number of fully covered days was much larger in sum- the precipitation sum into frequency and intensity (Fig. 4)
mer 1816 (21 days) than in the reference period (11 days). reveals that this can be fully explained by an increase in the
Similar as in the reference period, overcast days in sum- frequency of days with >0.1 mm of precipitation of 80 %.
mer 1816 were ca. 5.5 ◦ C colder during the day and 2.5 ◦ C The mean rainfall intensity (8 mm per day with >0.1 mm
warmer during the night compared to clear days (Table 1), precipitation) was the same in summer 1816 than for the av-
again resulting in an 8 ◦ C effect on DTR. However, in sum- erage summer of the reference period (note that within the
mer 1816 all temperature anomalies were much more nega- reference period, average summer precipitation intensities
tive compared to the short reference period. Fully covered vary between 4 and 12 mm d−1 , hence there is a consider-
summer days in 1816 were 1.1 ◦ C and 1.9 ◦ C colder than the able variation). Not only did the mean intensity not change,
reference for sunrise and 14:00 LT, respectively. Clear sum- but we also find no evidence for changes in the distribution
mer days were even 1.6 ◦ C and 2.5 ◦ C colder than in the ref- of precipitation intensities (Fig. 4, right panel). A χ 2 -test
erence period, for sunrise and 14:00 LT, respectively. (4 classes with theoretical frequencies > 5) yields a p-value
Can the temperature anomalies be explained by cloud of 0.96. The highest daily precipitation amount in summer
cover alone? Table 1 (row 5) shows estimated average 1816 was 47.5 mm, which is slightly higher than the maxi-
temperature anomalies for summer 1816 for sunrise and mum in the reference period (43 mm), but even higher val-
14:00 LT (for cloudy plus clear days) assuming mean val- ues occurred in the two excluded years 1810 and 1811. The
ues for the corresponding categories in the short reference second highest amount (among 43 rainy days) was 27.2 mm.
period. These numbers can then be compared to observed This rainfall amount corresponds to the 96-percentile of the
anomalies (for cloudy plus clear days) in 1816. For the reference period, i.e. an excellent match. The fact that ex-
14:00 LT value, the estimated anomaly is −2.16 ◦ C com- treme precipitation events were not more frequent in 1816
pared to an observed −4.67 ◦ C. Hence, about 50 % of the than in “normal” summers contradicts to some extent the
afternoon summer temperature anomalies in 1816 can be ex- contemporary Swiss newspaper reports, which often speak
plained by a simple cloud metric. Note, however, that this about torrential rain falls and thunderstorms (see Bodenmann
www.clim-past.net/8/325/2012/ Clim. Past, 8, 325–335, 2012
330 R. Auchmann et al.: Extreme climate, not extreme weather: the summer of 1816 in Geneva, Switzerland
et al., 2011, although the reports cited therein do not specifi- 4
anomalies of precip. (mm/day) or temperature (°C)
cally refer to the region of Geneva).
On the contrary to the wet summer 1816, a notably dry 3
summer appears in 1818 (Fig. 4). Both the total annual
2
precipitation sum and also the number of precipitation days
were the lowest within the whole period 1799–1821. Van der
1
Schrier et al. (2007) use the self-calibrated Palmer Drought
Severity Index (Wells et al., 2004) to identify wet and dry 0
seasons over the Alps. Negative index values (dry condi-
tions) within a prolonged period of positive values (1816– -1
1825; wet conditions) for the NW-sector of the Greater
Alpine region (including Geneva) for summer 1818 confirm -2
our results. Furthermore, reconstructed SLP anomalies from
Luterbacher et al. (2002) for summer 1818 show, in large -3
contrast to the summer 1816, positive SLP anomalies (with
-4
the center west of the northern British Isles) covering almost
Stationary-SW
High-N
Low-N
Rising-N
Falling/Stat.-N
Falling-SW
Rising-NE
Falling/Stat.-NE
High-SW
Low-SW
Rising-SW
Front
High-Rest
Low-Rest
Rising-Rest
Rest
all Europe (Trigo et al., 2009).
3.4 Frequency of weather types
For the 14:00 LT observation, we addressed the role of the
mesoscale circulation by defining weather types and analyz- Fig. 5. Temperature anomalies (red) and precipitation (blue pat-
ing whether those types that typically are cold and rainy were terned) averaged for each weather type for the summer months
more frequent in 1816 than in other years. Ideally, the clas- (June to August) in the reference period. Note that for visualization
sification should be chosen such that the classes that can be purposes, precipitation is plotted as anomalies from the seasonal
interpreted synoptically and distinguished from each other mean whereas the sampling operates with absolute values.
(i.e. large distance between classes in terms of mean tem-
perature anomalies and precipitation) and at the same time
have a small variability of these variables within each class. categories low, medium, or high pressure using the thresh-
For forming classes, we confined ourselves to air pressure olds −1 and +0.75 s.d., respectively. The category medium
and wind direction because they define the atmospheric cir- pressure was further subdivided into rising, stationary, and
culation most directly. Cloud cover is seen as a dependent falling pressure using the thresholds ±0.2 s.d. This results
variable and hence was not used to define weather types, es- in a clearly defined and small (41 cases) class representing
pecially since the time series is not homogeneous. vigorous frontal passages as well as five large classes.
Wind occurrences provided a classification of wind di- Each of these five classes could be subdivided into nine
rection into nine classes (calm, N, NE, W, SE, S, SW, W, subclasses according to wind direction. However, this would
NW). For pressure we used both the actual values as well as result in a large number of classes, some of which represent
the tendency over the past 24 h to separate days into high, very similar situations. We therefore combined subclasses
low, rising, falling, and stationary pressure (see below). The according to the following rules: no class can have less
large annual variation in pressure variations made it nec- than 30 members; classes to be combined must be neighbor-
essary to base the classification on standardized anomalies, ing (e.g. NW and W wind direction); and if several options
where annual cycles of both the mean and the standard devi- were possible, the one that produced the smallest within-
ation (s.d.) were computed as the first two harmonics of the class standard deviation for temperature was chosen. Due to
corresponding data for each day-of-year from the reference orographic wind channeling (see Fig. 1), SW and NW winds
period. Plotting the standardized data revealed an asymmet- prevailed in all 5 pressure classes. This allows for some syn-
ric distribution for pressure, but not for the pressure tendency. optic interpretation. For instance, high pressure with SW
Hence, we considered non-symmetric thresholds in the case winds can occur with W or NW gradient wind (and corre-
of pressure. spondingly, temperatures are lower than for high pressure
Cases with very low pressure or with very fast rising or situation with other wind directions).
falling pressure are often associated with the passage of a The resulting classification for the reference period is
cold front. These cases show distinct temperature and pre- shown in Table 2. Figure 5 shows the corresponding anoma-
cipitation anomalies. We used thresholds of ±2.5 s.d. for the lies of temperature and precipitation in the reference period.
pressure tendency and a threshold of −2.5 s.d. for pressure. The final classification had 16 classes, with sizes between 36
All days that crossed one of the three thresholds were consid- (“low pressure, rest”) and 222 (“high pressure, northerly
ered as frontal passages. The other days were separated into wind”). Mean temperature anomalies for the classes ranged
Clim. Past, 8, 325–335, 2012 www.clim-past.net/8/325/2012/
R. Auchmann et al.: Extreme climate, not extreme weather: the summer of 1816 in Geneva, Switzerland 331
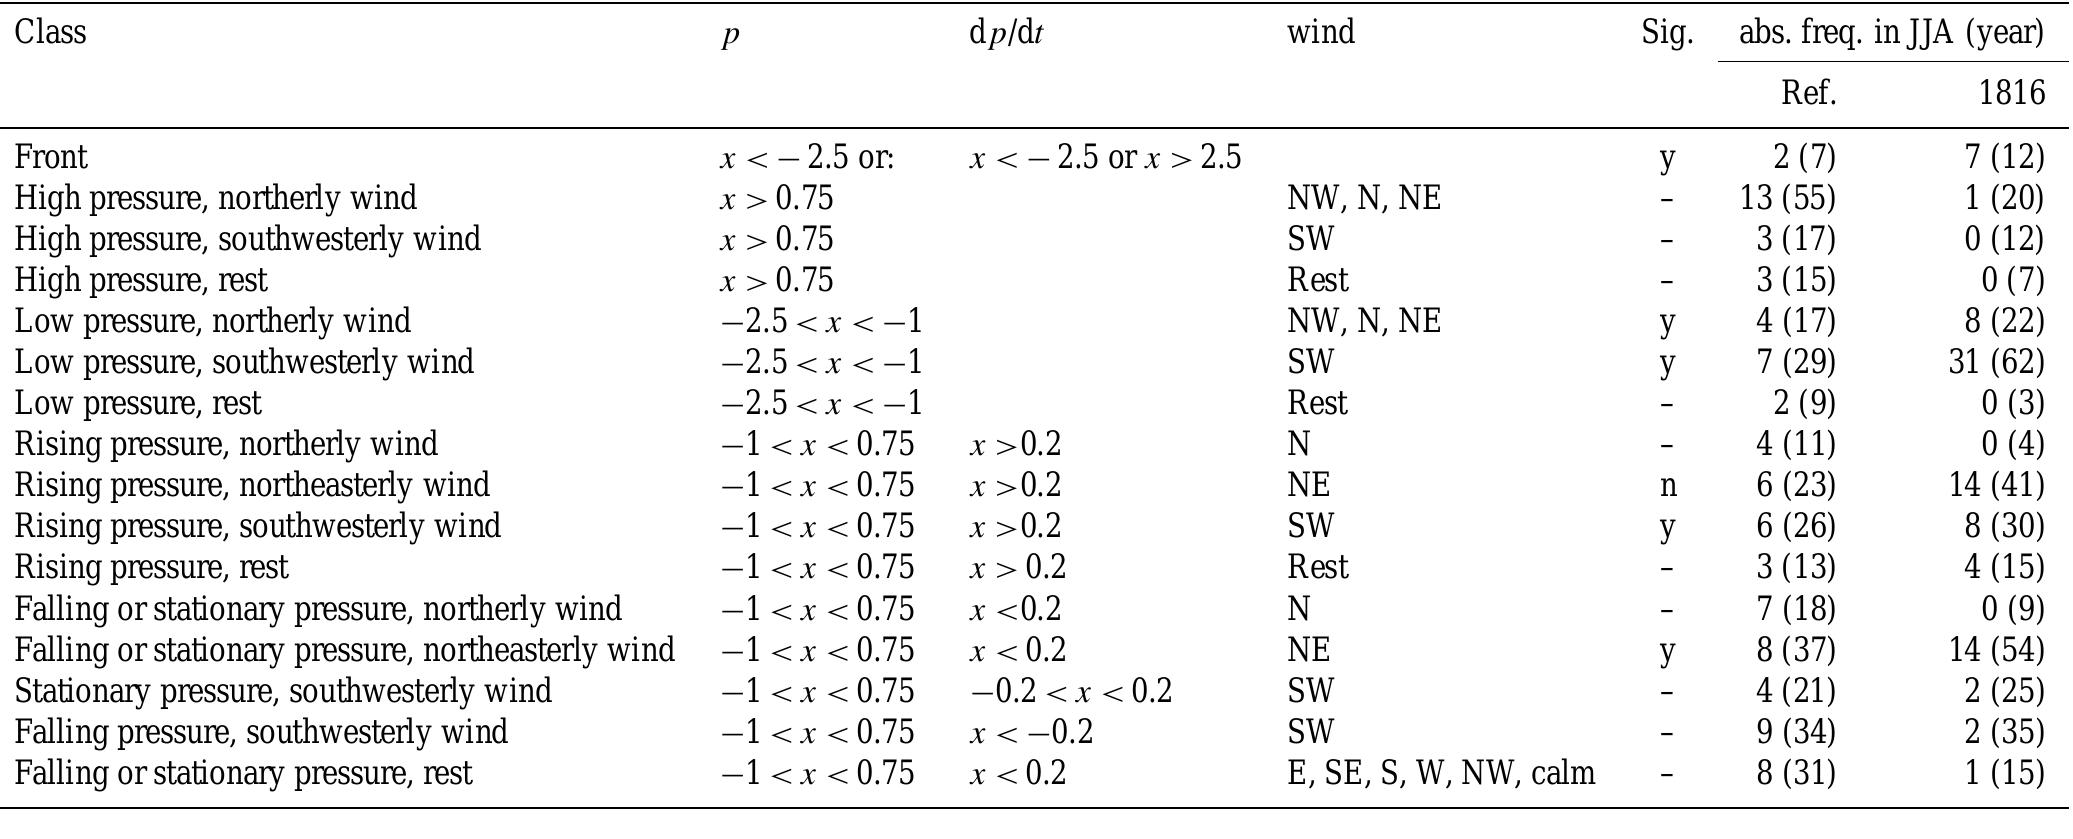
Table 2. Weather type classification. Note that days classified as “fronts” could theoretically also fit in other categories, but were attributed
to “front” (in practice this occurred only rarely). The fifth column indicates whether significant (p < 0.05) differences were found within this
weather type between 1816 and the reference period according to a Wilcoxon test (y = yes, n = no, – = not enough cases). The sixth column
indicates mean absolute frequencies of a weather type in the reference period for an average summer, JJA (annual averages). The last column
indicates absolute frequencies of a weather type for summer 1816, JJA, in brackets: frequencies for the entire year 1816.
Class p dp/dt wind Sig. abs. freq. in JJA (year)
Ref. 1816
Front x < − 2.5 or: x < − 2.5 or x > 2.5 y 2 (7) 7 (12)
High pressure, northerly wind x > 0.75 NW, N, NE – 13 (55) 1 (20)
High pressure, southwesterly wind x > 0.75 SW – 3 (17) 0 (12)
High pressure, rest x > 0.75 Rest – 3 (15) 0 (7)
Low pressure, northerly wind −2.5 < x < −1 NW, N, NE y 4 (17) 8 (22)
Low pressure, southwesterly wind −2.5 < x < −1 SW y 7 (29) 31 (62)
Low pressure, rest −2.5 < x < −1 Rest – 2 (9) 0 (3)
Rising pressure, northerly wind −1 < x < 0.75 x >0.2 N – 4 (11) 0 (4)
Rising pressure, northeasterly wind −1 < x < 0.75 x >0.2 NE n 6 (23) 14 (41)
Rising pressure, southwesterly wind −1 < x < 0.75 x >0.2 SW y 6 (26) 8 (30)
Rising pressure, rest −1 < x < 0.75 x > 0.2 Rest – 3 (13) 4 (15)
Falling or stationary pressure, northerly wind −1 < x < 0.75 x <0.2 N – 7 (18) 0 (9)
Falling or stationary pressure, northeasterly wind −1 < x < 0.75 x < 0.2 NE y 8 (37) 14 (54)
Stationary pressure, southwesterly wind −1 < x < 0.75 −0.2 < x < 0.2 SW – 4 (21) 2 (25)
Falling pressure, southwesterly wind −1 < x < 0.75 x < −0.2 SW – 9 (34) 2 (35)
Falling or stationary pressure, rest −1 < x < 0.75 x < 0.2 E, SE, S, W, NW, calm – 8 (31) 1 (15)
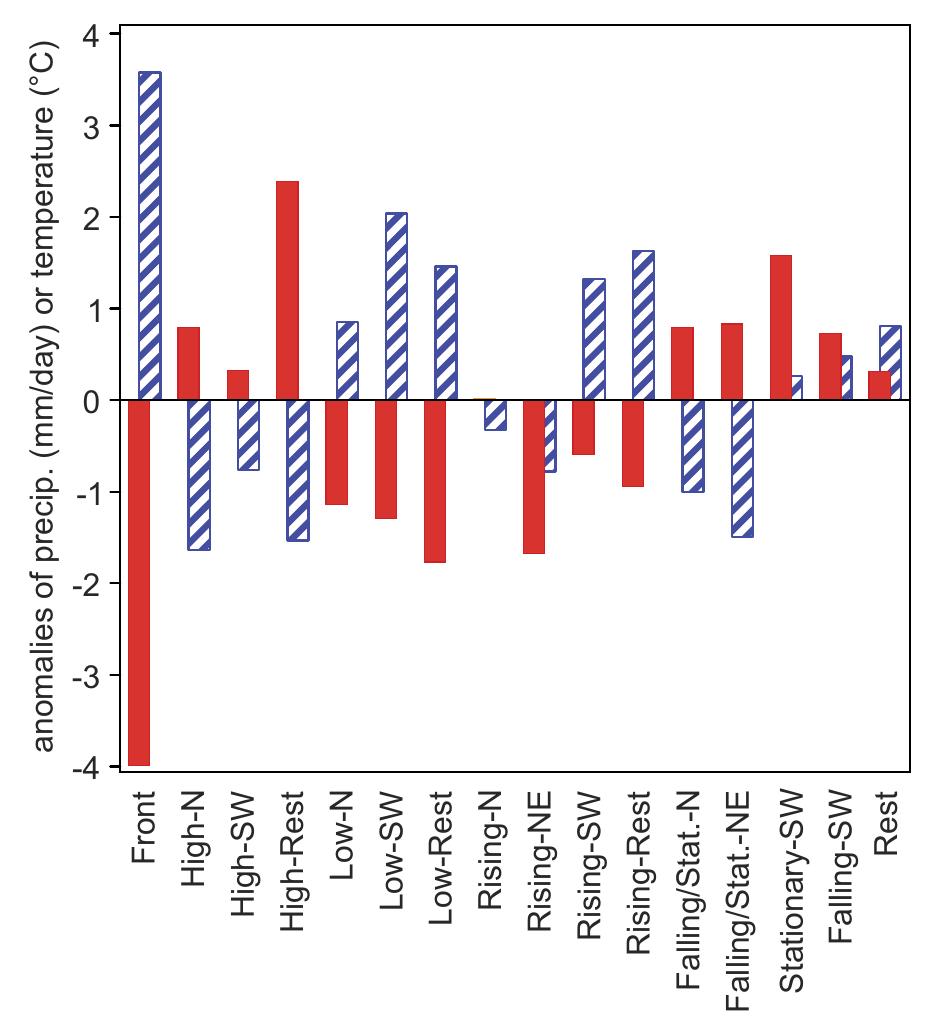
from −4.0 ◦ C (“front”) to +2.4 ◦ C (“high pressure, rest”). 35
1799−1821
Precipitation anomalies range from +3.4 mm d−1 (“front”) to 30
1816
−1.8 mm d−1 (“high pressure, northerly wind”). 25 1981−2010
frequency (%)
After the classification scheme was accepted, it was ap- 20
plied to the summer of 1816 and to the contemporary pe-
15
riod 1981–2010. A comparison of the obtained distribu-
10
tions of weather types in the reference and the period 1981–
5
2010 serves as a measure of usefulness of the classification
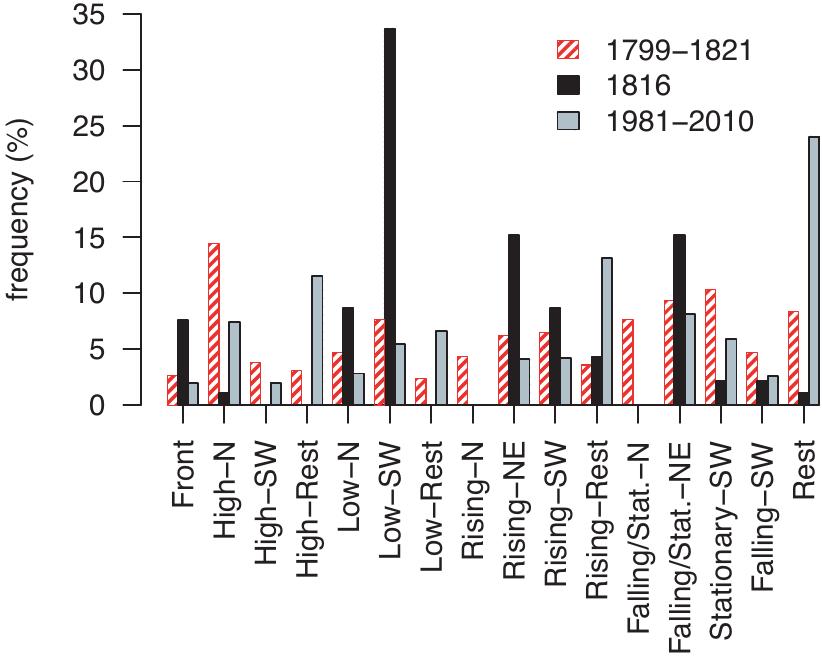
methodology. Figure 6 shows the distribution of weather 0
Front
High−N
High−SW
High−Rest
Rising−N
Rising−NE
Rising−SW
Rising−Rest
Rest
Low−N
Low−SW
Low−Rest
Stationary−SW
Falling/Stat.−N
Falling/Stat.−NE
Falling−SW
types in summer 1816, in the reference period, and in the pe-
riod 1981–2010 as a histogram. In general, markedly similar
patterns are obtained in the periods 1799–1821 and 1981–
2010. However, the class “Rest” is more frequent in the
period 1981–2010. We therefore claim that our classifica-
tion methodology and the thereof derived weather types can Fig. 6. Histogram showing the frequency of occurrence (percent)
be readily used for comparing local circulation patterns in of weather types in the summer months (June to August) of 1816
1816 to the reference period. The main differences between (black), in the reference period (red patterned), and in the period
1816 and the reference period are the almost complete ab- 1981–2010 (light grey).
sence of the three high pressure situations in summer 1816
(with only one case), which in the reference period together
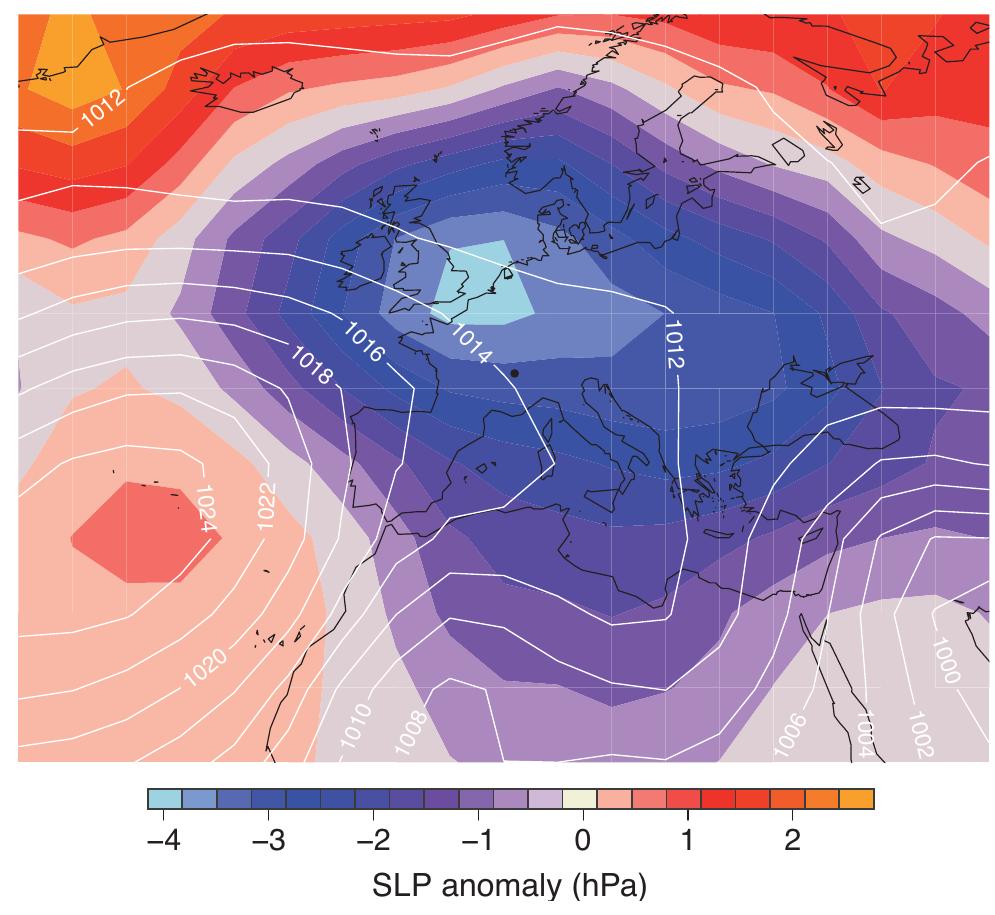
account for 21 % of the days (corresponding to 20 days in an A very large center with negative SLP anomalies appears
average summer). In contrast, the class “low pressure, south- over northern France. Geneva (dot in Fig. 7) was to the south
westerly winds” was 3.5 times as frequent in 1816 as in the of this center. This is expected from an increase in low pres-
reference period. Hence, the “year without summer” of 1816 sure situations and in situations with westerly geostrophic
in Geneva can be explained by frequency shifts of only few flow (which in Geneva could be channeled to southwesterly
weather types: an absence of high pressure situation and a wind). In addition Fig. 7b shows the reconstructed absolute
tripling of low-pressure situations. SLP values for June-to-August.
Seasonal SLP reconstructions from K¨uttel et al. (2010) are Casty et al. (2005b) investigated large scale climate
consistent with this result. Figure 7 shows the corresponding regimes over the North Atlantic/European sector since 1766.
anomalies for June-to-August with respect to the reference. They show that the period 1805–1825, which overlaps to
www.clim-past.net/8/325/2012/ Clim. Past, 8, 325–335, 2012
332 R. Auchmann et al.: Extreme climate, not extreme weather: the summer of 1816 in Geneva, Switzerland
10 000 repetitions) together with the actual values for sum-
mer 1816 as well as the mean values for summers in the ref-
12
10 erence period. While for temperature, the distribution is sym-
metric, it is slightly asymmetric for precipitation, indicating
that the uncertainty is higher towards the high precipitation
sums.
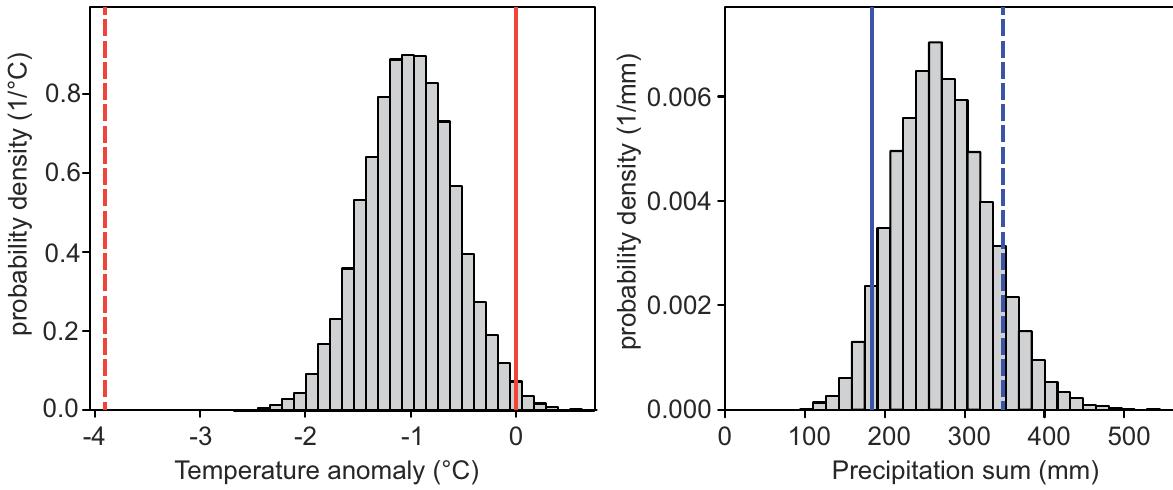
10 Out of 10 000 estimated 14:00 LT seasonal mean tempera-
1012
10
10 16
14
18
ture anomalies, 99 % of the values are below zero (and hence
below the reference period). The mean value is −1.00 ◦ C.
Hence, there is no doubt that unusual weather types affected
1022
1024
temperature in Geneva. However, the expected contribution
of the weather types to the actually observed anomaly is only
about one fourth. In fact, the actually observed anomaly is
100
20 well below the range of the Monte Carlo simulations. One
10
0
might be tempted to attribute the remainder to direct volcanic
0
1004
1002
08
06
101
10
10
effects. However, there might also be other effects that are
−4 −3 −2 −1 0 1 2
not captured by the classification. The weather types capture
SLP anomaly (hPa) an (unknown) mesoscale and not necessarily large-scale or
small-scale effects.
Fig. 7. SLP anomaly for summer (June to August) 1816 with re- To test this, we applied the same procedure (but now sam-
spect to the reference period and absolute SLP values (white con- pling only the mean values of a class) to all years in the ref-
tours). The dot marks the location of Geneva. erence period (during which no specific forcing was operat-
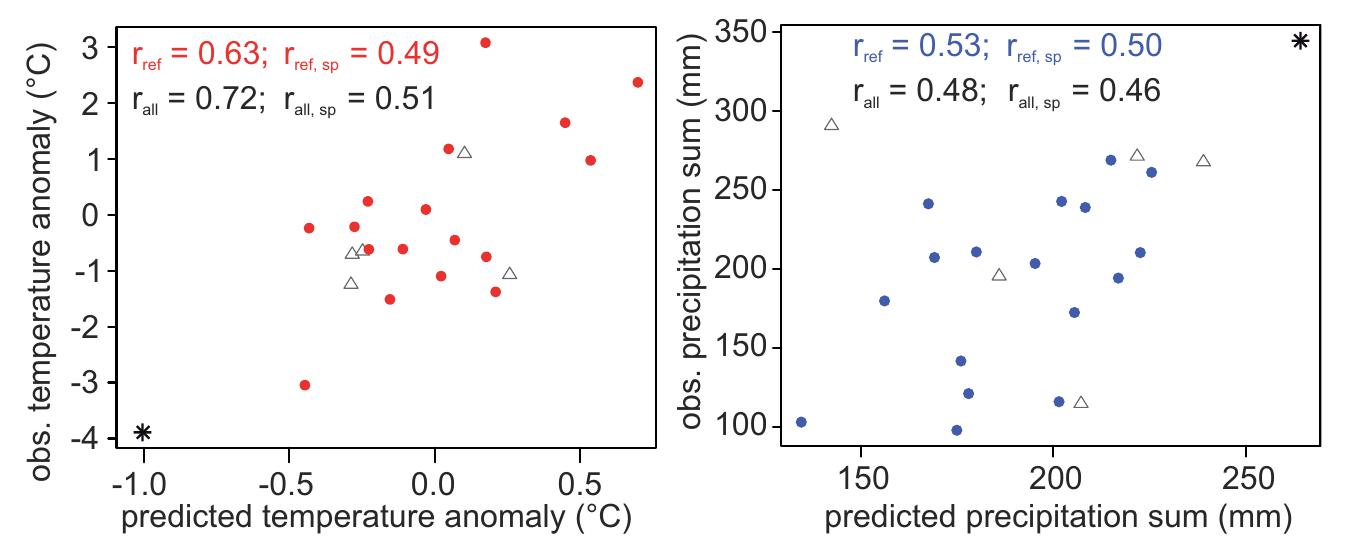
ing) and also to the summers of 1809, 1810, 1811, 1815, and
1817. Results are shown in Fig. 9. For temperature, there
a great extent the reference period, is characterized by an is a clear correlation between the artificial and the observed
anomalously westerly flow regime. However, the recon- temperature anomalies that reaches 0.72 when including all
structed parameters are confined to winter (December-to- years. This indicates that the not-captured part of the cir-
February). According to Casty et al. (2005a) analysis of culation effect on temperature correlates well with the cap-
Alpine temperatures, the cold summer 1816 was the coldest tured part. In other words, about 50 % (in terms of vari-
of a series of below-average summers, which followed a pe- ance) or 25 % (in terms of magnitude) of summer temper-
riod with generally warm summers between 1780 and 1810 ature anomalies can be explained by changing frequencies
(the warmest being 1807). While winter climate anomaly of weather types. The summer of 1816 lies close to a re-
patterns can be analyzed in the framework of large scale cir- gression line drawn through the data points in the reference
culation variability, this is more difficult for the summer sea- period (not shown). From this analysis we conclude that the
sons both because of weaker relations between climate and temperature anomaly in Geneva in 1816 is not inconsistent
circulation indices and the lower reconstruction skill of cir- with only a change in atmospheric circulation, although the
culation indices. In fact, the anomaly pattern of SLP (Fig. 7) uncertainty of the analysis is larger, leaving room for sub-
does not project strongly onto the NAO pattern but rather re- stantial non circulation-related cooling. At the same time, it
sembles the East Atlantic pattern. Whether this pattern is is important to note that the temperature anomaly predicted
affected by global volcanic forcing remains to be explored. only from the weather types is more than twice as negative
As the winter 1815/1816 was likely an El Ni˜no winter, re- as in any other case in the reference period.
mote effects from the tropical Pacific could be considered. We also analyzed whether or not there are significant dif-
There is a tendency for an excitement of such a pattern ac- ferences between temperature anomalies in 1816 and the ref-
companied by increased precipitation over central Europe in erence period within the same weather type. We performed
springs following El Ni˜no winters, which was also found in the Wilcoxon rank sum test for all classes for which at least
climate reconstructions (Br¨onnimann et al., 2007). However, seven days were available in 1816. With one exception (“Ris-
the relation between El Ni˜no and European climate is weak. ing pressure, northeasterly wind”), all classes exhibited a sig-
nificantly lower mean temperature in 1816 compared to the
3.5 Contribution of weather types to temperature reference period (Table 2). This analysis again suggests that
anomalies not all of the cooling can be captured by the weather type
frequencies, which can be due to an inadequate classification
How much of the afternoon cooling in summer 1816 can or a “missing” mechanism.
be reproduced from sampling corresponding weather types
in the reference period? Figure 8 shows estimated tem-
peratures anomalies and precipitation sums (histograms of
Clim. Past, 8, 325–335, 2012 www.clim-past.net/8/325/2012/
R. Auchmann et al.: Extreme climate, not extreme weather: the summer of 1816 in Geneva, Switzerland 333
probability density (1/°C)
probability density (1/mm)
0.8 0.006
0.6
0.004
0.4
0.002
0.2
0.0 0.000
-4 -3 -2 -1 0 0 100 200 300 400 500
Temperature anomaly (°C) Precipitation sum (mm)
Fig. 8. Histogram showing 10 000 artificial temperature anomaly averages (left panel) and precipitation sums (right panel) for the summer
of 1816 based on weather types for 1816 and sampling from these weather types in the reference period. The dotted and solid lines denote
the observed values for the year 1816 and the reference period, respectively.
350 rref = 0.53; rref, sp = 0.50
obs. precipitation sum (mm)
3 rref = 0.63; rref, sp = 0.49
obs. temperature anomaly (°C)
2 rall = 0.72; rall, sp = 0.51 rall = 0.48; rall, sp = 0.46
300
1
250
0
-1 200
-2
150
-3
-4 100
-1.0 -0.5 0.0 0.5 150 200 250
predicted temperature anomaly (°C) predicted precipitation sum (mm)
Fig. 9. Scatter plot showing the observed temperature anomalies (left panel) and precipitation sums (right panel) as a function of their
predicted values based only on the weather types information. The years in the reference period are indicated in red and blue (points), for
temperature and precipitation, respectively, the years that were excluded from the reference period are shown in grey (triangles), 1816 in
black (stars). Correlation (r) and non parametric Spearman correlation (rsp ) coefficients are shown for only the reference period (subscript
ref, red number) and all years (subscript all, black number).
3.6 Contribution of weather types to precipitation types far exceeds any other value in the 1799–1821 period.
anomalies The Wilcoxon test for within-class differences revealed sig-
nificant differences only for one class (“front”). Hence, we
The same analyses were performed with respect to precipi- have no evidence to falsify the hypothesis that the precipita-
tation. Of the 10 000 estimated precipitation sums for sum- tion anomalies are caused by atmospheric circulation.
mer 1816 (Fig. 8), 94 % are higher than the reference pe-
riod mean. Hence, there are indications that unusual weather 3.7 Contribution of weather types to cloud cover
types contributed to the precipitation surplus in Geneva in anomalies
summer 1816, but the uncertainty is much larger than in the
case of temperature. The uncertainty range includes the ob- We used the same methodology, albeit with the shorter
served value. calibration period, to estimate the fraction of cloud-free
Applying the procedure to all years (Fig. 9), we also find days (not shown). This variable could be well reproduced
correlations between observed and predicted precipitation, from weather types (estimated for 1816: 19.3 %, observed:
but compared to the analysis for temperature correlations 16.3 %, reference period: 25.2 %). According to the Monte
these are much lower and only significant for the reference Carlo simulation, the estimated fraction deviates signifi-
period (not for the full period). Only 25 % of the interan- cantly (p < 0.01) from the reference but not from the ob-
nual precipitation variability can be explained by changed served value.
weather types. The summer of 1816 falls within the relation
found in the reference period and hence is not inconsistent
with only a change in atmospheric circulation. However, as
for temperature, it is important to note that the precipitation
amount predicted for summer 1816 only from the weather
www.clim-past.net/8/325/2012/ Clim. Past, 8, 325–335, 2012
334 R. Auchmann et al.: Extreme climate, not extreme weather: the summer of 1816 in Geneva, Switzerland
4 Discussion and conclusions to persistent regional circulation and cloud cover anomalies
over Western Europe in summer.
We have digitized sub-daily meteorological data from the sta-
Supplementary material related to this
tion Geneva in order to analyze the “Year Without Summer”
article is available online at:
of 1816. We chose a sub-period of the record which was
http://www.clim-past.net/8/325/2012/
found to be homogeneous after the correction of one (known)
cp-8-325-2012-supplement.zip.
error. Comparing the YWS 1816 to the remainder of that pe-
riod (1799–1821) reveals that the coldness of the summer
1816 was most prominent in the afternoon. The entire tem- Acknowledgements. The project was supported by the Swiss
perature distribution function was shifted by almost 4 ◦ C to- National Science Foundation via the NCCR Climate project
wards lower values with no apparent change in variability. In PALVAREX, by the cogito foundation, by the Department of
contrast, early morning temperatures show a significant de- Environmental Sciences, ETH Zurich and by the COST Action
HOME. Data for this study were digitized within the framework of
crease in the variability, but no changes in negative extremes
the cooperative DigiHom project of MeteoSwiss and ETH Zurich.
and a smaller change for the mean.
We would like to thank Michael Begert, Christine F¨ullemann, and
Possible causes for changes between 1816 and the ref- Mischa Croci-Maspoli (all MeteoSwiss) for providing metadata
erence period include direct radiative changes (due to vol- and helpful discussions. Thanks also to St´ephane Fischer (Mus´ee
canic aerosols or clouds), changes in the mesoscale circu- d’Histoire des Sciences, Geneva) for information on historic
lation (e.g. the frequency of weather types), and changes in instruments.
the large-scale climate system (e.g. a cooling of the oceans).
The mechanisms are not independent and hence hardly sep- Edited by: P. Brohan
arable. Although an attribution of the causes is not possible
using only observational data, they still provide interesting
References
insights which, if well characterized, can be used in model
comparisons. Alexander, L. V.: Global observed changes in daily climate ex-
Analyzing cloud information suggests that an increase in tremes of temperature and precipitation, J. Geophys. Res., 111,
cloud cover was mainly responsible for time-of-day charac- D05109, doi:10.1029/2005JD006290, 2006.
teristics of the temperature change. But what changed the Baron, W. R.: 1816 in perspective: the view from the Northeastern
clouds? A simple weather type classification (according to United States, in: The year without a summer?: world climate in
1816, edited by: Harrington, C. R., Canadian Museum of Nature,
pressure, pressure tendency, and wind direction) well ex-
Ottawa, 124–144, 1992.
plains the changes in cloud cover. About one fourth of the Bodenmann, T., Hirsch Hadorn, G., Br¨onnimann, S., Kr¨uger, T.,
deviation in the seasonal mean afternoon temperature can be and Weissert, H.: Perceiving, understanding, and observing cli-
explained by changes in weather type (i.e. the mesoscale cir- matic changes: An historical case study of the “year without
culation). Although this may seem a small fraction, it cor- summer” 1816, Meteorol. Z., 20, 577–587, doi:10.1127/0941-
responds exactly to the expected fraction of explained vari- 2948/2011/0288, 2011.
ance for any anomalous year. Importantly, the amount of Bradley, R. and Jones, P. D.: Records of explosive volcanic erup-
weather-type-related cooling was much larger than in other tions over the last 500 years, in: Climate Since A.D. 1500, edited
years and the within-type differences of afternoon temper- by: Bradley, R. S. and Jones, P. D., Routledge, London, 1995.
ature were significant in most cases. For precipitation, our Brandsma, T. and K¨onnen, G. P.: Application of nearest
analysis shows that the 80 % increase in summer precipita- neighbor resampling for homogenizing temperature records
on a daily to sub-daily level, Int. J. Climatol., 26, 75–89,
tion can be explained solely by a higher frequency of precip-
doi:10.1002/joc.1236, 2006.
itation, while no change could be found in the 24-h intensity Briffa, K. and Jones, P. D.: the climate of Europe during the 1810s
of precipitation (including the occurrence of extremes). with special reference to 1816, in: The year without a summer?:
In all, the results show that the year without summer world climate in 1816, edited by: Harrington, C. R., Canadian
was not characterized by extreme weather (the tails of the Museum of Nature, Ottawa, 372–391, 1992.
distributions did not change much except for cold after- Briffa, K., Jones, P. D., Schweingruber, F., and Osborn, T.: In-
noons), but extreme climate (i.e. the statistics of weather fluence of volcanic eruptions on Northern Hemisphere Summer
types changed). The analysis shows that the local-to-regional temperature over the Past 600 Years, Nature, 393, 450–455,
1998.
circulation plays a dominant role in that all climatic anoma-
Br¨onnimann, S., Xoplaki, E., Casty, C., Pauling, A., and Luter-
lies are statistically consistent with only a change in circula- bacher, J.: ENSO influence on Europe during the last centuries,
tion. Historical analyses show that in Switzerland, strong Clim. Dynam., 28, 181–197, doi:10.1007/s00382-006-0175-z,
tropical volcanic eruptions are often followed by a “Year 2007.
Without Summer” with very similar weather as in the sum- Casty, C., Handorf, D., and Sempf, M.: Combined climate win-
mer of 1816 (Pfister, 1999, see also Fischer et al., 2007), ter regimes over the North Atlantic/European sector 1766–2000,
suggesting a mechanism linking tropical volcanic forcing Geophys. Res. Lett., 32, 13, doi:10.1029/2005GL022431, 2005a.
Clim. Past, 8, 325–335, 2012 www.clim-past.net/8/325/2012/
R. Auchmann et al.: Extreme climate, not extreme weather: the summer of 1816 in Geneva, Switzerland 335
Casty, C., Wanner, H., Luterbacher, J., Esper, J., and B¨ohm, Pfister, C.: Wetternachhersage: 500 Jahre Klimavariationen und
R.: Temperature and precipitation variability in the Euro- Naturkatastrophen (1496–1995), Paul Haupt, Bern, 1999.
pean Alps since 1500, Int. J. Climatol., 25, 1855–1880, Pictet, M. A.: Biblioth`eque universelle des sciences, belles-lettres
doi:10.1002/joc.1216, 2005b. et arts Sciences et arts, Imprimerie de a biblioth`eque universelle
Chenoweth, M.: Two major volcanic cooling episodes derived from ed, Gen`eve, 1822.
global marine air temperatures, Geophys. Res. Lett., 28, 2963– Piervitali, E., Conte, M., and Colacino, M.: Summer air tempera-
2966, 2001. ture anomalies in europe during the century 1811–1910, Il Nuovo
Chenoweth, M.: Daily synoptic weather map analysis of the New Cimento, C20, 195–208, 1997.
England cold wave and snowstorms of 5 to 11 June 1816, in: His- Robock, A.: Review of year without a summer? World climate in
torical climate variability and impacts in North America, edited 1816, Climatic Change, 26, 105–108, 1994.
by: Dupigny-Giroux, L.-A. and Mock, C. J., Springer, Dor- Robock, A.: Volcanic eruptions and climate, Rev. Geophys., 38,
drecht, 2009. 191–219, 2000.
Cole-Dai, J., Ferris, D., Lanciki, A., Savarino, J., Ba- Schuepp, M.: Lufttemperatur, Beiheft zu den Annalen der SMZ,
roni, M., and Thiemens, M. H.: Cold decade (AD 1810– Fotorotar AG, Z¨urich, 1961.
1819) caused by Tambora (1815) and another (1809) strato- Self, S., Rampino, R. R., and Barbera, J. J.: The possible effects
spheric volcanic eruption, Geophys. Res. Lett., 36, L22703, of large 19th and 20th century volcanic eruptions on zonal and
doi:10.1029/2009GL040882, 2009. hemispheric surface temperatures, J. Volcanol. Geoth.-Res., 11,
Fischer, E., Luterbacher, J., Zorita, E., Tett, S., Casty, C., and Wan- 41–60, 1980.
ner, H.: European climate response to tropical volcanic eruptions Shindell, D., Schmidt, G., Mann, M., and Faluvegi, G.: Dy-
over the last half millennium, Geophys. Res. Lett., 34, L05707, namic winter climate response to large tropical volcanic erup-
doi:10.1029/2006GL027992, 2007. tions since 1600, J. Geophys. Res.-Atmos., 109, D05104,
Harrington, C. R.: The year without a summer?: world climate in doi:10.1029/2003JD004151, 2004.
1816, Ottawa: Canadian Museum of Nature, 1992. Sigrist, R. and Bungener, P.: The first botanical gardens in geneva
Hoyt, J.: The cold summer of 1816, Ann. Assoc. Am. Geogr., 48, (c. 1750–1830): private initiative leading science, St. Hist. Gard.
118–131, 1958. Des. L., 28, 333–350, 2008.
Kington, J.: Weather patterns over Europe in 1816, in: The year Skeen, E. K.: The Year without a Summer: A Historical View, J.
without a summer?: world climate in 1816, edited by: Harring- Early Republ., 1, 51–67, 1981.
ton, C. R., Canadian Museum of Nature, Ottawa, 358–371, 1992. Stendel, M., Mogensen, I., and Christensen, J.: Influence of various
K¨uttel, M., Xoplaki, E., Gallego, D., Luterbacher, J., Garc´ıa- forcings on global climate in historical times using a coupled
Herrera, R., Allan, R., Barriendos, M., Jones, P. D., Wheeler, D., atmosphere-ocean general circulation model, Clim. Dynam., 26,
and Wanner, H.: The importance of ship log data: reconstructing 1–15, 2005.
North Atlantic, European and Mediterranean sea level pressure Stommel, H. and Stommel, E.: Volcano Weather: The Story of
fields back to 1750, Clim. Dynam., 34, 1115–1128, 2010. 1816, The Year without a Summer, Seven Seas Press ed., New-
Lean, J., Beer, J., and Bradley, R.: Reconstruction of solar irradi- port, Rhode Island, 1983.
ance since 1610: Implications for climate change, Geophys. Res. Stothers, R.: The great Tambora eruption in 1815 and its aftermath,
Lett., 22, 3195–3198, 1995. Science, 224, 1191–1198, 1984.
Luterbacher, J., Xoplaki, E., Dietrich, D., Rickli, R., Jacobeit, J., Stothers, R.: Volcanic dry fogs, climate cooling and plague pan-
Beck, C., Gyalistras, D., Schmutz, C., and Wanner, H.: Recon- demics in europe and the middle east, Climatic Change, 42, 713–
struction of sea-level pressure fields over the eastern North At- 723, 1999.
lantic and Europe back to 1500, Clim. Dynam., 18, 545–561, Trigo, R. M., Vaquero, J. M., Alcoforado, M. J., Barriendos, M.,
doi:10.1007/s00382-001-0196-6, 2002. Taborda, J., Garcia-Herera, R., and Luterbacher, J.: Iberia in
Luterbacher, J., Dietrich, D., Xoplaki, E., Grosjean, M., and Wan- 1816, the year without a summer, Int. J. Climatol., 29, 99–115,
ner, H.: European seasonal and annual temperature variability, 2009.
trends and extremes since 1500 a.d., Science, 303, 1499–1503, van der Schrier, G., Efthymiadis, D., Briffa, K. R., and Jones, P.
2004. D.: European Alpine moisture variability for 1800–2003, Int. J.
Mann, M., Bradley, R., and Hughes, M.: Global-scale temperature Climatol, 27, 415–427, doi:10.1002/joc.1411, 2007.
patterns and climate forcing over the past six centuries, Nature, Wells, N., Goddard, S., and Hayes, M. J.: A self-calibrating
392, 779–787, 1998. Palmer Drought Severity Index, J. Climate, 17, 2335–2351,
Oppenheimer, C.: Climatic, environmental and human conse- doi:10.1175/1520-0442(2004)017<2335:ASPDSI>2.0.CO;2,
quences of the largest known historic eruption: Tambora volcano 2004.
(Indonesia) 1815, Prog. Phys. Geog., 27, 230–259, 2003. Winkler, P.: Revision and necessary correction of the long-term
Pfister, C.: The Years without a Summer in Switzerland: 1628 and temperature series of Hohenpeissenberg, 1781–2006, Theor.
1816, in: The year without a summer?: world climate in 1816, Appl. Climatol., 98, 259–268, 2009.
edited by: Harrington, C. R., Canadian Museum of Nature, Ot-
tawa, 416–417, 1992.
www.clim-past.net/8/325/2012/ Clim. Past, 8, 325–335, 2012